Figure 4.
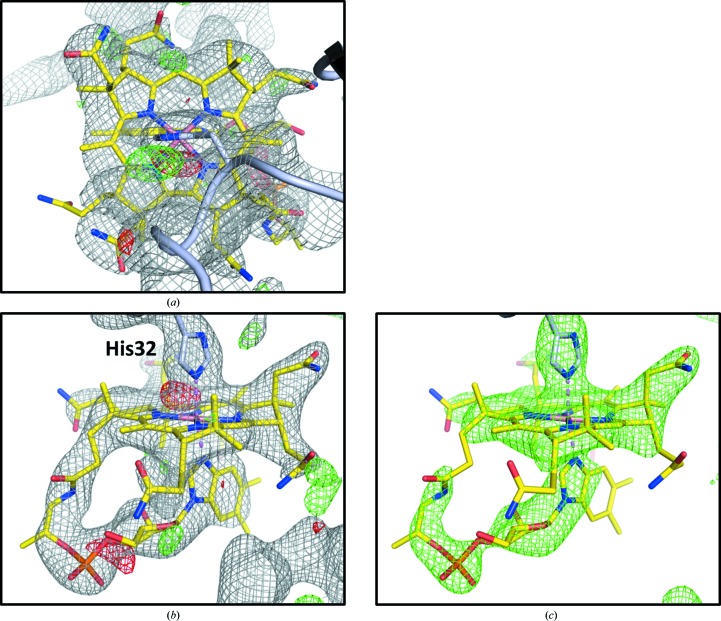
Crystallographic evidence of the cpEutL–B12 interaction. Placement of the hydroxocobalamin ligand (yellow sticks) in the model is justified by 2mF o − DF c and mF o − DF c electron-density maps (a), (b) and also by an omit map (c). The electron density supports a binding mode in which His32 (light blue sticks) ligates the Co atom (violet) at the center of the corrin ring. The gray mesh represents a 2mF o − DF c map contoured at 1.0σ, and the green/red mesh represents an mF o − DF c difference map (or similar type of omit map) contoured at 3.0σ.

