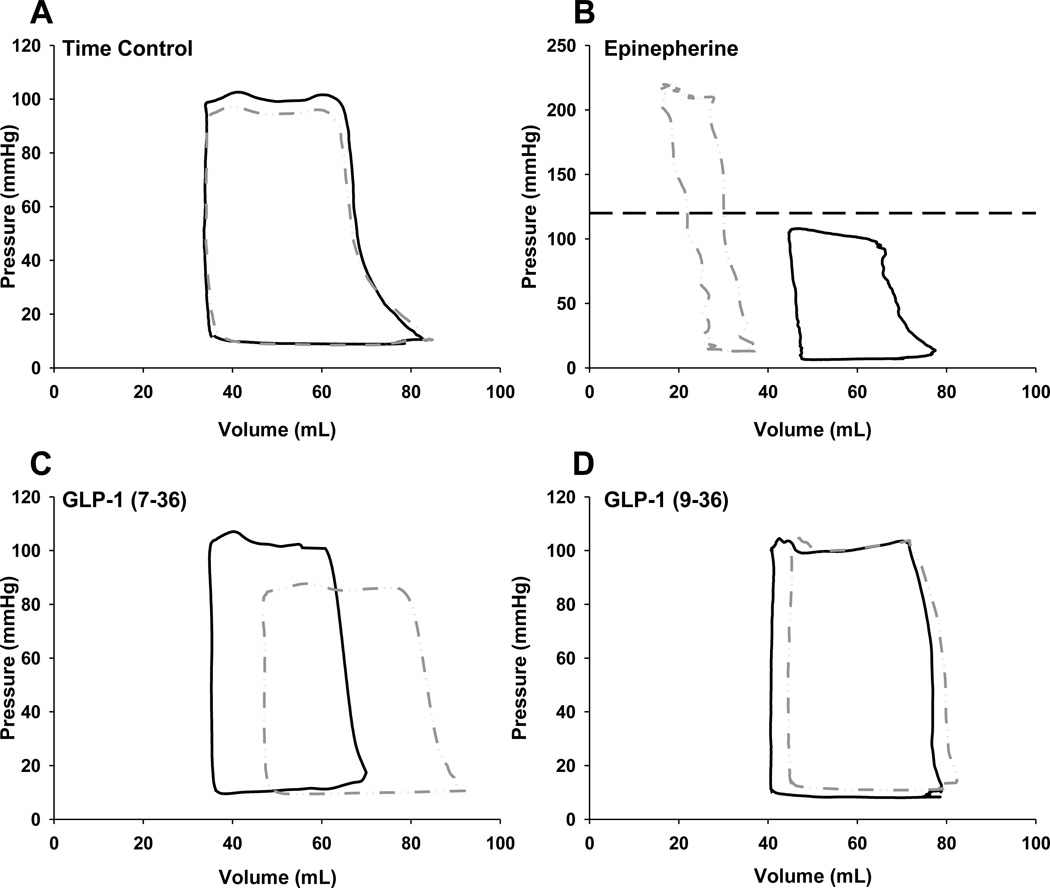
Figure 3.
Representative pressure-volume loops from saline infused time controls (Panel A), GLP-1 (7–36) (Panel C) and GLP-1 (9–36) (Panel D) treated animals at the highest infusion rate (10 pmol/kg/min) during normal perfusion (solid line; black) and subsequent to induction of regional myocardial ischemia (interrupted line; gray). Each representative loop is the result of averaging 3 consecutive loops from 3 separate animals during plateau of responses during the relevant, presented conditions. Panel B provides representative data from a single animal (3 averaged loops per condition) demonstrating effect of epinephrine on pressure volume relationships (interrupted gray line) during normal myocardial perfusion. Note the change in scale of Panel B; the dashed line represents the maximal Y scale value of other panels.

