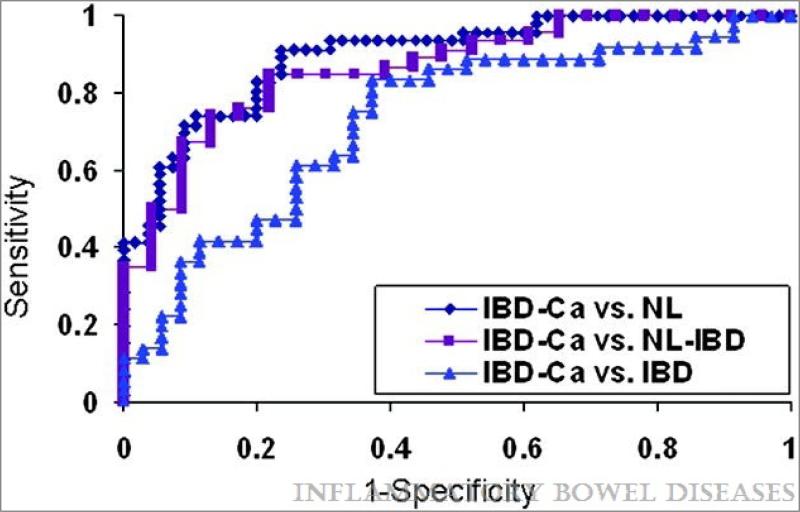
Figure 3.
ROC curve analysis of miR-224 expression levels determined by qRT-PCR. Individual miR-224 qRT-PCR levels were grouped according to their pathology. NL = normal from patients without IBD or colorectal cancer history; NL-IBD = normal “unaffected” specimens from IBD patients; IBD = “affected” chronically inflamed specimens from IBD patients; IBD-Ca = cancer specimens from IBD patients. AUROC for the IBD-Ca vs. NL, NL-IBDs or IBD was 0.896 (0.83-0.95 95% confidence interval) ,0.865 (0.77-0.95 95% confidence interval) and 0.73 respectively (0.61-0.84 95% confidence interval) x-axis = 1-sensitivity. y-axis = specificity

