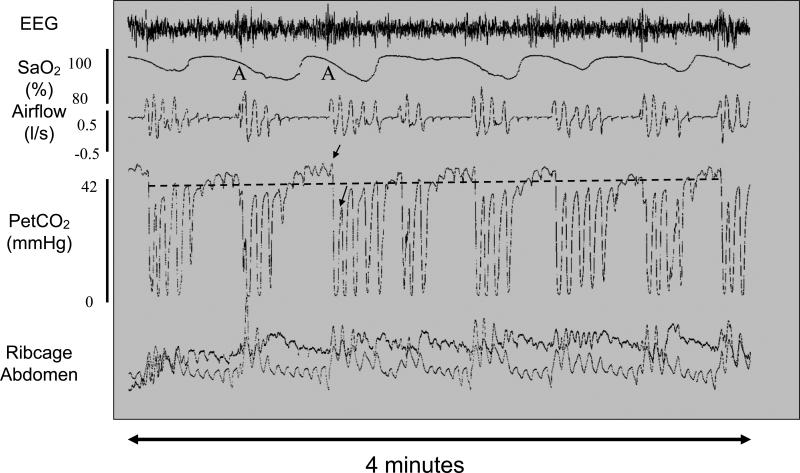
Figure 1.
Typical OSA breathing pattern with recurrent obstructive events. This polysomnogram from a patient with obstructive sleep apnea shows multiple cycles over a four minute period of airway collapse accompanied by hypercapnia and hypoxia and terminating with arousal (A) and airway restoration. Traces show (from top to bottom) EEG, arterial oxygen saturation (SaO2), airflow (liters/sec), end tidal partial pressure of CO2 (PetCO2), ribcage and abdominal movements. Obstructive apneas are characterized by reduced or absent airflow despite attempts to breathe as shown by rib cage and abdominal movements. Hypoxia is measured by a pulse oximeter. The level of CO2 in exhaled air at the end of an expiratory cycle approximates the partial pressure of CO2 in arterial blood, whereas the signal drops towards zero during inspiration. In this example airflow was reduced but not completely abolished during the obstructions. The dotted line overlying the trace indicates average end tidal CO2. Note the rise in CO2 during the airway obstruction and the large breaths that accompany arousal at apnea termination and that drive the CO2 below baseline. The two arrows on the trace indicate the PetCO2 during the last obstructed breath and the first unobstructed breath. The magnitude of the PetCO2 undershoot is thought to contribute to the likelihood of another obstructive event occurring when the individual falls back to sleep. Adapted from [6].

