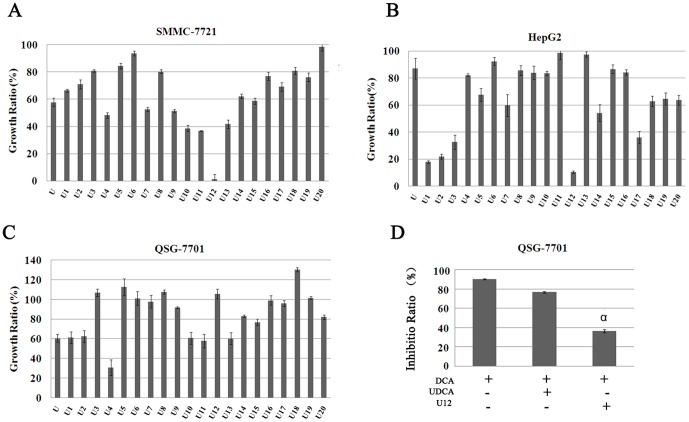
Figure 2. Evaluation of UDCA and its derivatives effects on different cell lines.
The growth ratio of UDCA and its 20 different derivatives on (A) SMMC-7721, (B) HepG2, and (C) QSG-7701 were detected by MTT assay. (A–C shows the ratios relative to untreated controls). All compounds were administered at concentrations under 100 µM and allowed to incubate for 24 h. (D) QSG-7701 cells were either untreated or pretreated with 100 µM UDCA and U12 for 18 h. The cultures were replaced with 300 µM DCA and allowed to incubate for 6 h and then an MTT assay was performed to assess the ability of UDCA and U12 to rescue cytotoxicity induced by DCA. Results are representative of three independent experiments, showing mean±SD (α, P<0.05, compared with UDCA treatment).

