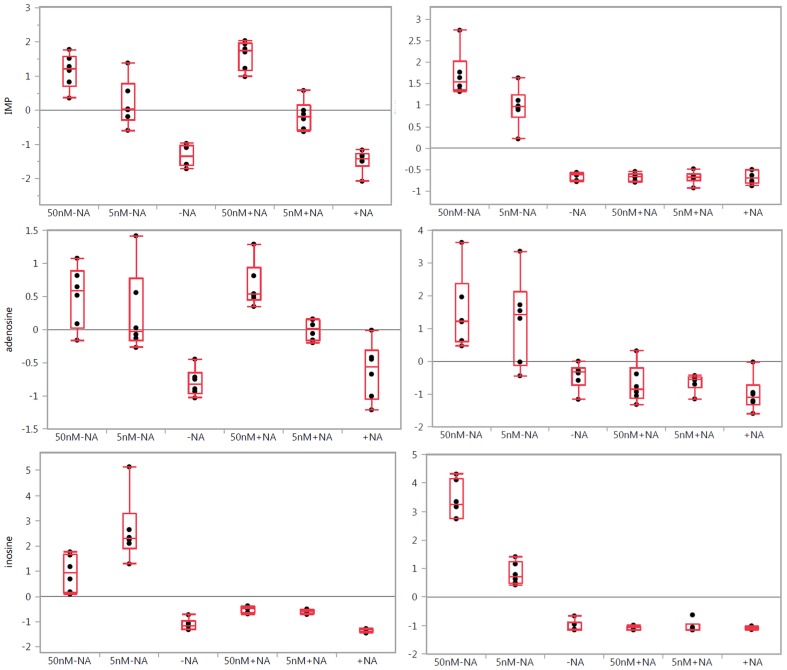
Figure 2. One-way analysis of variance box plots illustrating the observed level changes in the selected purines: inosine monophosphate (IMP), adenosine, and inosine after FK866 treatment at 50 and 5 nM concentrations in A2780 (left panels) and HCT-116 (right panels) cells, respectively, with (+NA) and without (−NA) nicotinic acid addition.
Grand mean is shown as a horizontal line located within panel. The y-axis illustrates normalized, log transformed, and scaled peak area. Dots represent samples. Group mean shown as a horizontal line within the box.

