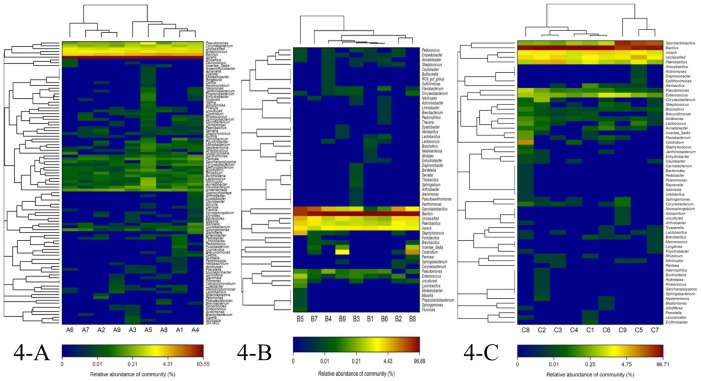
Figure 4. Hierarchical dendrogram of bacterial distribution.
Bacterial distribution of the top 100 abundant genus in the fermented liquid diet that sampled from A libraries, B libraries and C libraries. Double hierarchical dendrogram shows the bacterial distribution. The bacterial phylogenetic tree was calculated using the neighbor-joining method and the relationship among samples was determined by Bray-Curtis distance. The heatmap plot depicts the relative percentage of each bacterial genus within each sample. The relative values for bacterial genus are indicated by color intensity with the legend at the bottom.

