
Figure 1. Plasma CXCL3 concentration.
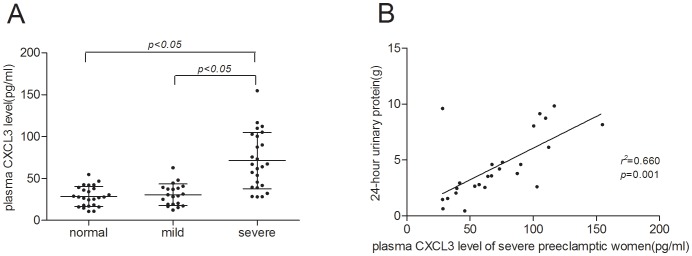
A:Plasma CXCL3 levels of normal pregnant women, mild preeclamptic pregnant women and severe preeclamptic pregnant women. Middle line: median; Whisker: standard deviation. B: The correlation between plasma CXCL3 levels of the severe PE group participants with 24-hour urinary protein.