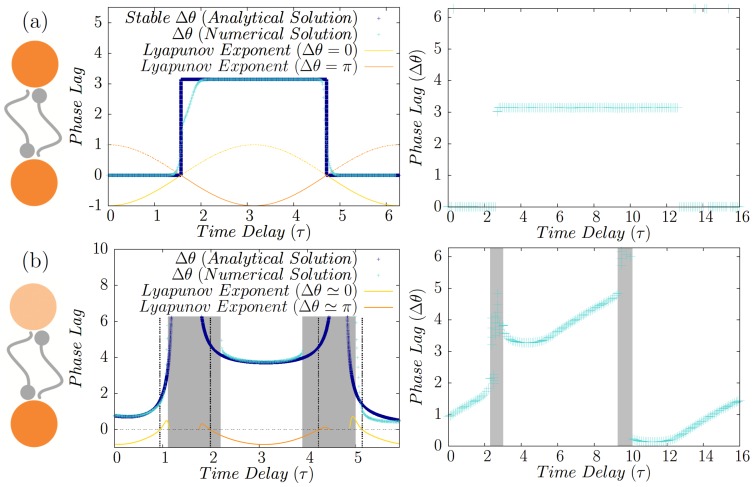
Figure 2. Homogeneous and inhomogeneous system of directly coupled neurons.
(a) Synchronized states of two directly coupled identical type-II neurons. Depending on the delay time inphase or antiphase modes are stable with negative corresponding Lyapunov exponent which are shown for both the states (left panel). Phase difference ( ) of firing of two identical Hodgkin-Huxely neurons is plotted in the right panel. (b) Synchronized states of two directly coupled neurons in presence of frequency mismatch. Numerical solutions (Cyan) affirm the validity of the analytical results obtained from linear approximation (Dark Blue). Lyapunov exponent for each of the locked states are also shown. Shaded area show the regions where no 1∶1 locking mode is seen in numerical results, and the dashed gray lines are the boundary of stability of analytic solution with negative Lyapunov exponents. In the right panel the phase difference is shown for two HH neurons with different firing rates.

