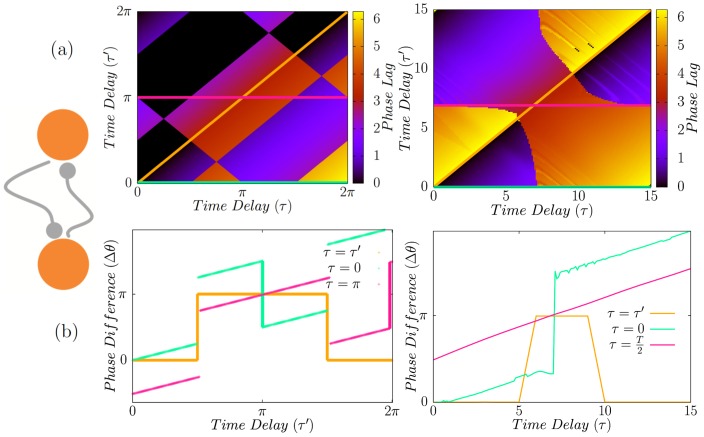
Figure 3. Directly coupled neurons with unequal delays.
(a) Phase lag of two directly coupled neurons for different transmission time delays. In (b) we have shown the results for  (along diagonal in (a)) and with fixed
  (along horizontal lines in (a)). Synchrony can only been seen for homogeneous system
  . Figures in right column present the results for HH neurons. Even though the patterns are not the same, the main result still holds and synchrony can not be seen with unequal delays.
  in the bottom-right panel is the period of the firing of HH neurons in the locked state.

