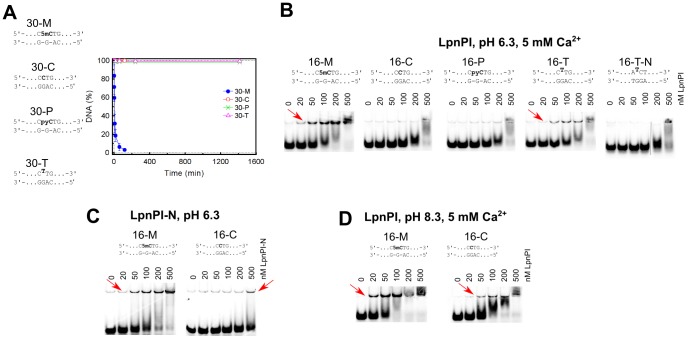
Figure 2. DNA cleavage and binding by LpnPI.
The sequences in all panels depict recognition sites in the oligoduplex substrates. (A) DNA cleavage experiments. The reactions were performed with 500 nM enzyme (monomer) and 400 nM substrate at 25°C. Time courses of the reactions are shown. The reaction rate constant for the 30-M substrate equals 0.20±0.05 min−1. Reaction rate constants for other substrates were lower than 1×10⁻⁵ min−1. (B) Electrophoretic mobility shift assay with LpnPI. DNA binding experiments were performed in a pH 6.3 buffer in the presence of 5 mM Ca2+ ions. The final substrate concentration was 10 nM, LpnPI concentrations (in terms of monomer) are indicated above the gel lanes. Red arrows mark the location of the protein-DNA complexes. (C) Electrophoretic mobility shift assay with LpnPI DNA binding domain (LpnPI-N). Experiments with the cognate (16-M) and non-cognate (16-C) substrates were performed in a pH 6.3 buffer in the absence of Ca2+ ions. (D) Electrophoretic mobility shift assay with LpnPI in a pH 8.3 buffer in the presence of Ca2+ ions.

