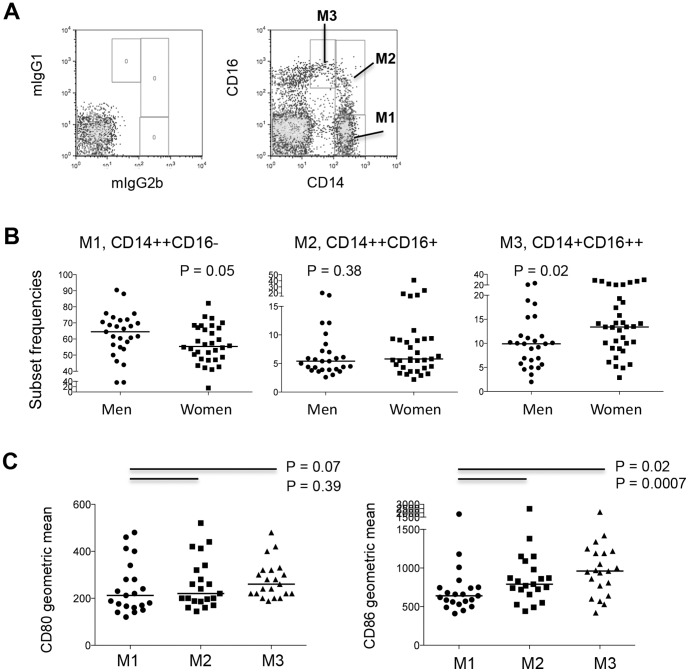
Figure 1. Increased percentage of the non-classic monocyte subset in total monocytes in control women compared to control men.
(A) Dot plots of gating strategy for monocyte subsets. (B) Percentage (median) of classic (M1, CD14++CD16-), intermediate (M2, CD14+CD16+) and non-classic (M3, CD14+CD16++) monocyte subsets in women and men in fresh blood-samples. (C) Geometric mean of CD80 and CD86 expression among 3 subsets of monocytes tested in fresh blood-samples.

