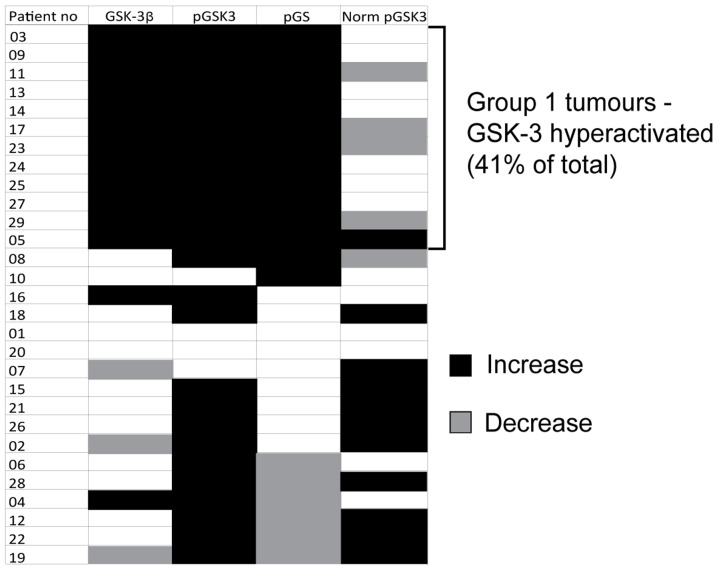
Figure 4. Summary of GSK3 activity in all patients.
Three distinct samples from normal and patient-matched tumour tissues were analysed using Luminex (xMAP) technology to determine the level of GSK3β expression, GS phosphorylation (S641/645) and GSK3α/β phosphorylation (S21/9). GSK3 phosphorylation has also been normalised to GSK3 expression. The strength of evidence of difference in expression/phosphorylation between the normal and tumour samples was determined by Kruskal-Wallis test. Expression/phosphorylation of each protein/site was then coded according to whether it increased (black), decreased (grey) at p≤0.05 or remained unchanged (white; p>0.05) in the tumour samples relative to normal tissue. The coded data were then grouped according to the direction of change in GSK3 expression: patients in Group I showed an increase in GSK3 expression and GS phosphorylation.

