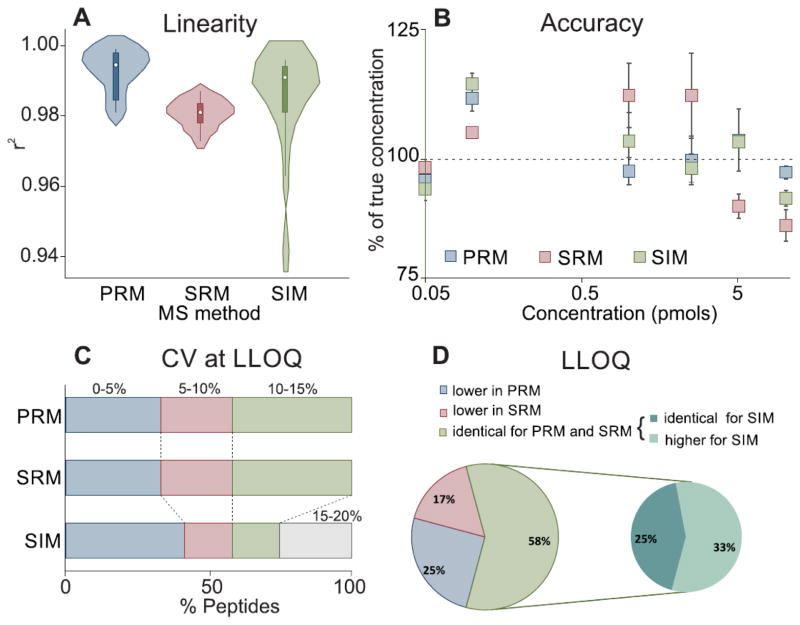
Figure 2.
Comparison of the performances of PRM, SRM, and SIM for quantifying a standard curve of 12 [15N]APOA1 peptides in HDL matrix. (A) Distribution of r2 values obtained for PRM, SRM, and SIM presented as a violin plot. The white dot in the center of each solid rectangular box is the median of the data, the upper and lower values of the rectangular box indicate the 75th and 25th percentiles, and the spikes of the rectangles are the range of the data. The width of the plot outside the modified box plot is the density of values (i.e., the fraction of Y values within each interval of Y values). (B) Residuals (difference between the measured concentration and expected value) obtained by PRM, SRM, and SIM for the heavy peptide DYVSQFEGSALGK. The scale of the X axis is logarithmic. (C) Percentage distribution of CVs at LLOQ for PRM, SRM, and SIM. (D) Comparison of the LLOQ values for PRM, SRM, and SIM for each quantified peptide.

