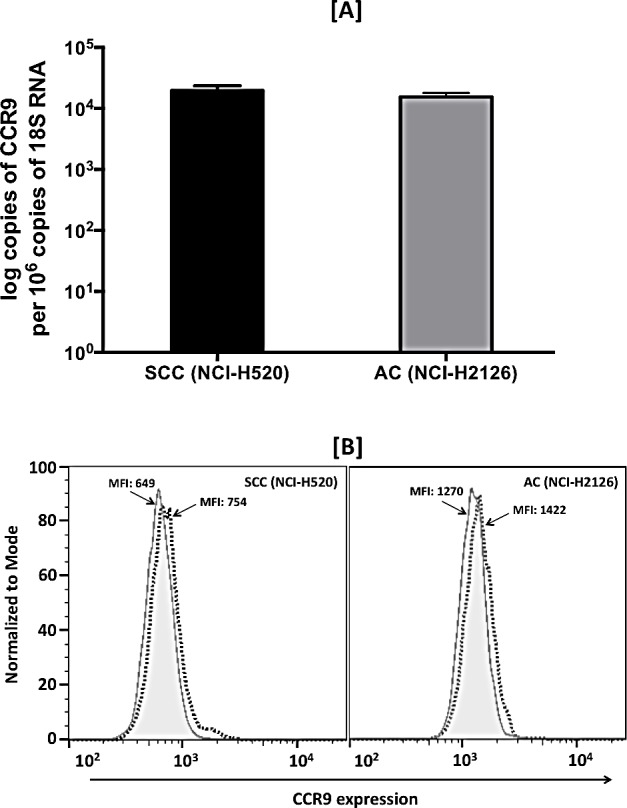
Figure 3. Expression of CCR9 in LuCa cell lines.

[A] Total RNA was isolated from SCC (NCI-H520) and AC (NCI-H2126) cells. Quantitative RT-PCR analysis of CCR9 mRNA expression was performed in triplicate. The copies of transcripts are expressed relative to copies of 18S rRNA mean +/− S.D., n=2. The asterisk indicates statistical significance (p = 0.0432) between SCC and AC cells. [B] SCC (NCI-H520) and AC (NCI-H2126) cells were stained with PE-conjugated isotype control antibodies (solid histogram) or PE-conjugated anti-CCR9 monoclonal antibodies (dashed histogram) and quantified by flow cytometry. The mean fluorescent intensities (MFIs) of PE-positive cells are shown.
