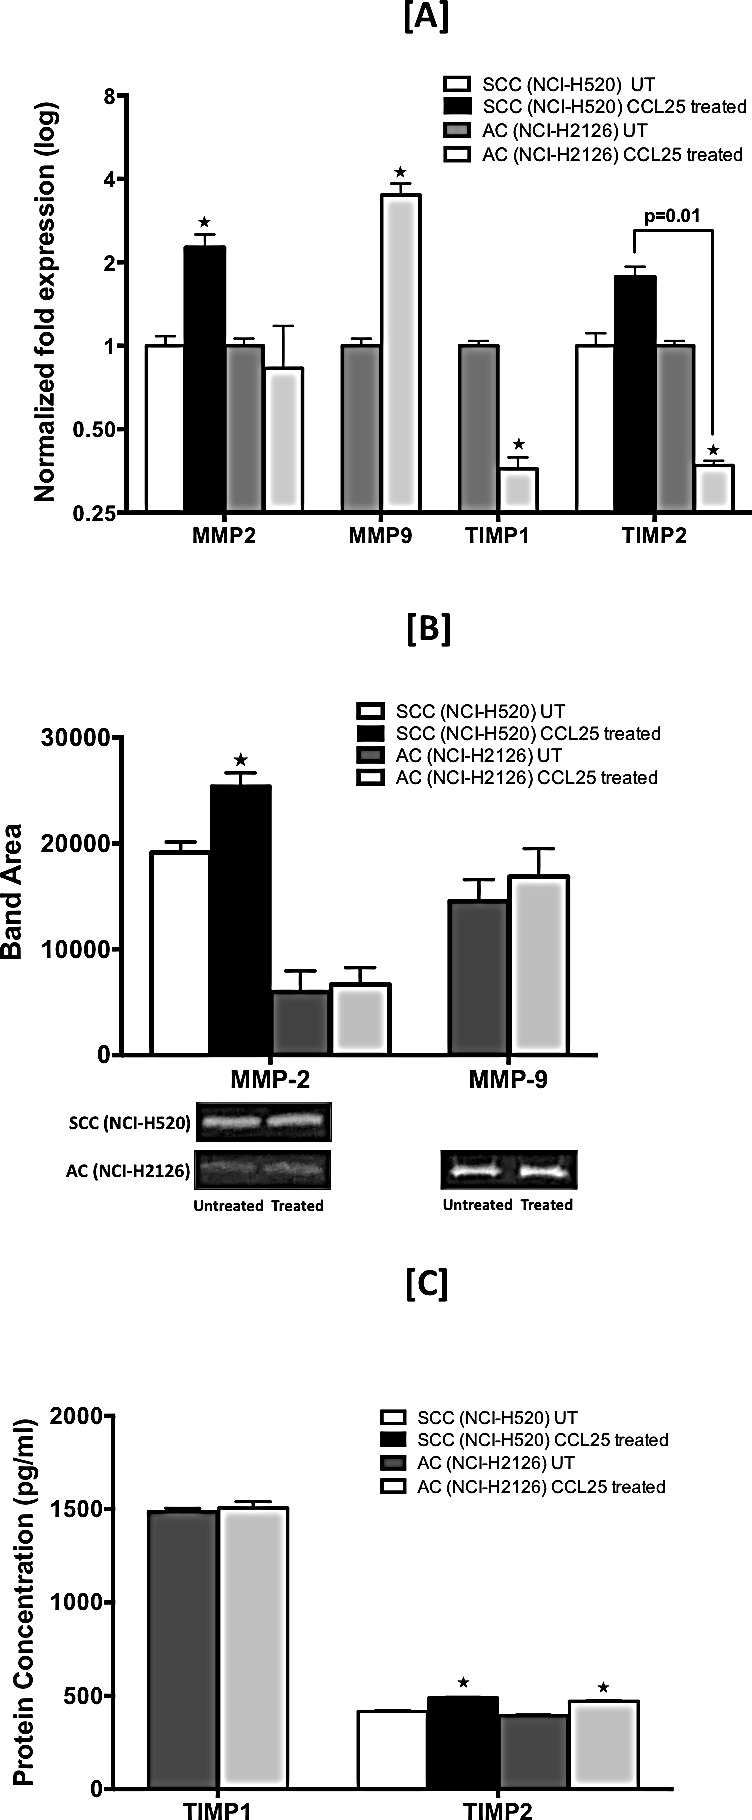
Figure 5. CCL25-induced expression of MMPs and TIMPs in LuCa cells.

Cells were tested for their capacity to express mRNA and protein for MMP-2 and -9 and TIMP-1 and -2. [A] SCC (NCI-H520) and AC (NCI-H2126) cells were treated for 30 min with 0 or 100 ng/mL of CCL25. Total RNA was isolated, and quantitative real time-PCR analysis was performed for mRNA expression of MMP-2 and -9 and TIMP-1 and -2. Transcript copies were presented relative to copies of 18S rRNA. [B] Active gelatinases (MMP-2 and -9) in culture supernatants were quantified by gelatin zymography. Cells were stimulated with CCL25 (0 or 100 ng/ml) for 24 h. Top: Graph represents densitometric analysis of zymography for control and treated samples, presented as band area, analyzed by ImageJ software. Bottom: Representative zymography. [C] TIMP-1 and TIMP-2 in culture supernatants were quantified by ELISA. Bars represent the concentration (pg/ml) of TIMP-1 and TIMP-2 in culture supernatants collected from cells treated with 0 or 100 ng/ml of CCL25 for 24 h. Asterisks show significant differences between untreated and CCL25-treated LuCa cells. Data was analyzed by non-parametric two tailed t-test and presented as mean +/− S.D., n=2. * p < 0.05.
