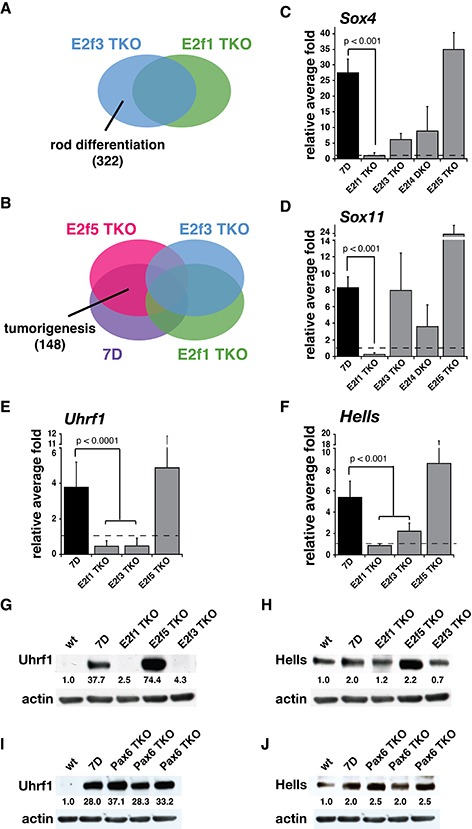
Figure 4. Identification and characterization of Rb target genes in retinal development and retinoblastoma.

(A-B) Venn diagrams of the gene expression array comparisons used to identify potential Rb target genes involved in (A) rod differentiation and (B) tumorigenesis. Number of genes identified in parenthesis. (C-F) Real-time RT-PCR analysis shows increased Sox4 (C) and Sox11 (D) mRNA levels in P21 retinae from Chx10-Cre;Rblox/lox;p107−/− (7D), Chx10-Cre;Rblox/lox;p107−/−;E2f3lox/lox (E2f3 TKO), Chx10-Cre;Rblox/lox; E2f4−/− (E2f4 DKO) and Chx10-Cre;Rblox/lox;p107−/−;E2f5lox/lox (E2f5 TKO) but not Chx10-Cre;Rblox/lox;p107−/−;E2f1−/− (E2f1 TKO) compared to wt retinae. It also shows increased Uhrf1 (E) and Hells (F) mRNA levels in P21 retinae from 7D and E2f5 TKO but nor E2f1 TKO and E2f3 TKO compared to wt retinae. Each bar is the mean and standard deviation of 5 biological replicates ran in duplicate. (G-J) Western blot analysis from P21 mouse retinae show increased Uhrf1 (G) and Hells (H) protein levels in 7D and E2f5 TKO retinae but not E2f1 TKO and E2f3 TKO retinae compared to wt. (I) Uhrf1 and (J) Hells protein levels are also overexpressed in Chx10-Cre;Rblox/lox;p107−/−;Pax6lox/lox (Pax6 TKO) retinae at P21 when compared to wt. Data were normalized to actin.
