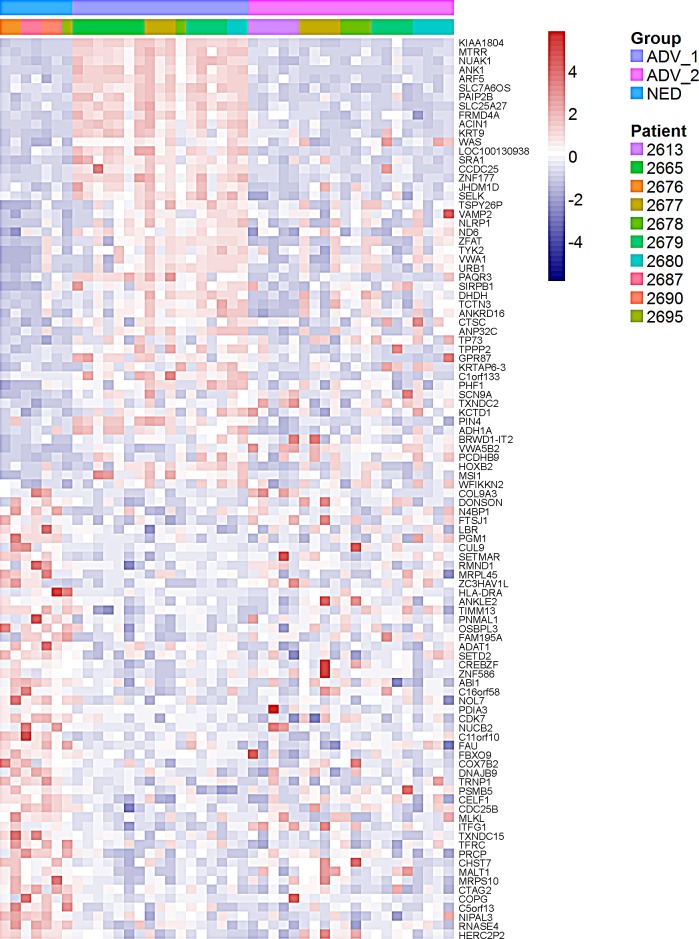
Figure 4. Heat map demonstrates individual prostate cancer DTC from patients with no evidence of disease [NED] are similar to a subset of prostate cancer DTC from advanced patients [ADV].
A supervised analysis of the top 50 and bottom 50 genes differentially expressed between NED patients and ADV_1 patients. Cells on the right of the figure were obtained from ADV patients and clustered into 2 groups (ADV_1: purple on top horizontal bar and ADV_2: pink on top horizontal bar). Cells on the left of the figure were obtained from NED patients and clustered into a single group (blue on top horizontal bar). Each color in the second bar represents a different patient.

