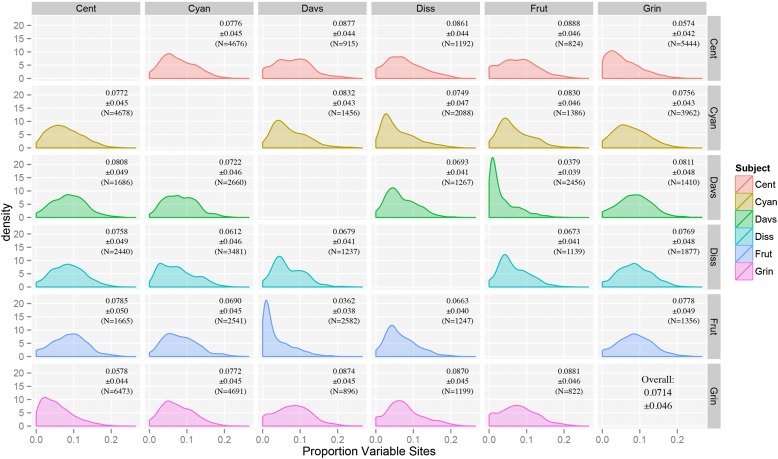
Fig. 3.
Plot of pairwise comparisons of sequence variation among the six low-coverage genomes using BLASTN (Cent = P. centranthifolius, Cyan = P. cyananthus, Davs = P. davidsonii, Diss = P. dissectus, Frut = P. fruticosus, Grin = P. grinnellii). Rows represent the species used as the database, and columns represent the species used as the query (e.g., row Cent, column Grin represents a BLASTN search with P. grinnellii as the query and P. centranthifolius as the database). Mean sequence variation ± SEs and sample size are shown in the upper right corner of each graph. Note that the matrix is not symmetric due to differences between using the same set of sequences as both a query and as a database for a BLAST search (e.g., Frut vs. Cyan ≠ Cyan vs. Frut).

