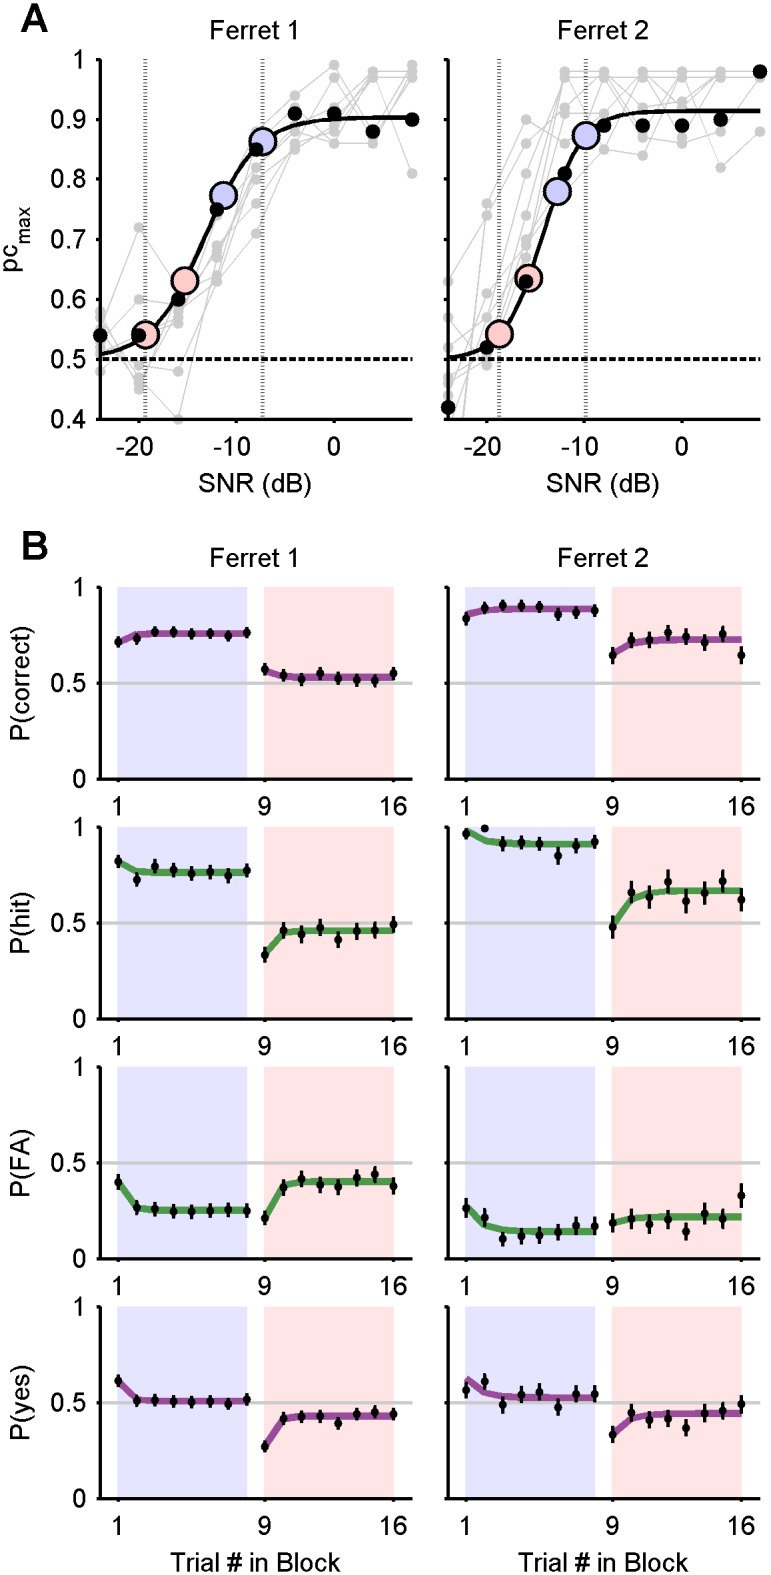
Figure 3. Alternating 8-trial blocks results for ferrets 1 and 2.

A) Psychometric functions measured over 6 sessions (dots), expressed as a function of attenuation, and a sigmoid fit (black line). Attenuations corresponding to the easy and hard signal levels are marked as blue and pink discs, respectively. Grey lines and markers show the psychometric functions periodically obtained to monitor performance. B) 8-trial block experiment results (see Fig. 2C).
