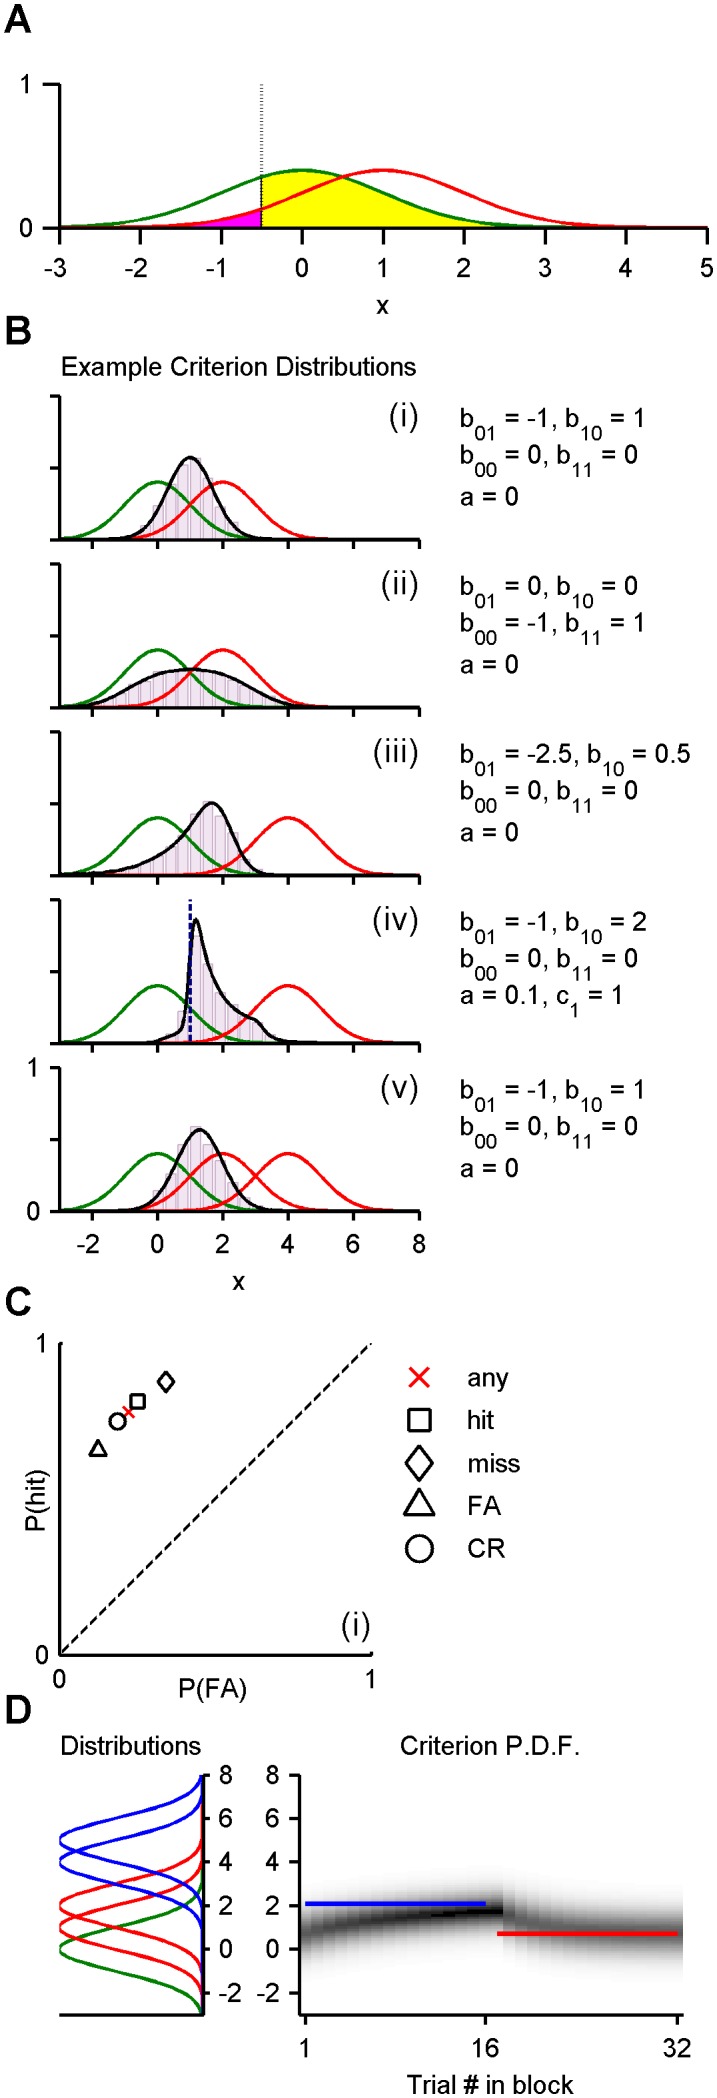
Figure 5. Markov analysis of the criterion shift model.

A) Normal probability density functions for no-signal distribution (green curve) and signal distribution (red curve). All distributions have unit variance. Solid areas indicate probabilities of a miss (pink) and false alarm (yellow) given an example criterion position (dotted vertical). B) Stationary criterion distribution (black curve) for four exemplary parameter sets. Criterion histograms obtained from 10,000 Monte Carlo trials are plotted in faint purple. Where it exists, the resting criterion (c 1) is plotted as a dashed blue vertical. C) ROC performance for the model depicted in B(i) conditional upon the outcome of the previous trial (see key). D) Method adapted to analyse alternating blocks of 16 trials. Model parameters are those used in B(i). Left: internal variable distribution, given no signal (green), easy signals (blue), and hard signals (red). Right: p.d.f. of stationary criterion distribution (grayscale) as a function of trial position within blocks. Minimum error criteria are superimposed as blue (easy) and red (hard) horizontal lines. In all examples, the probability of a signal is 50%, and where there are multiple signal distributions, they are chosen from uniformly.
