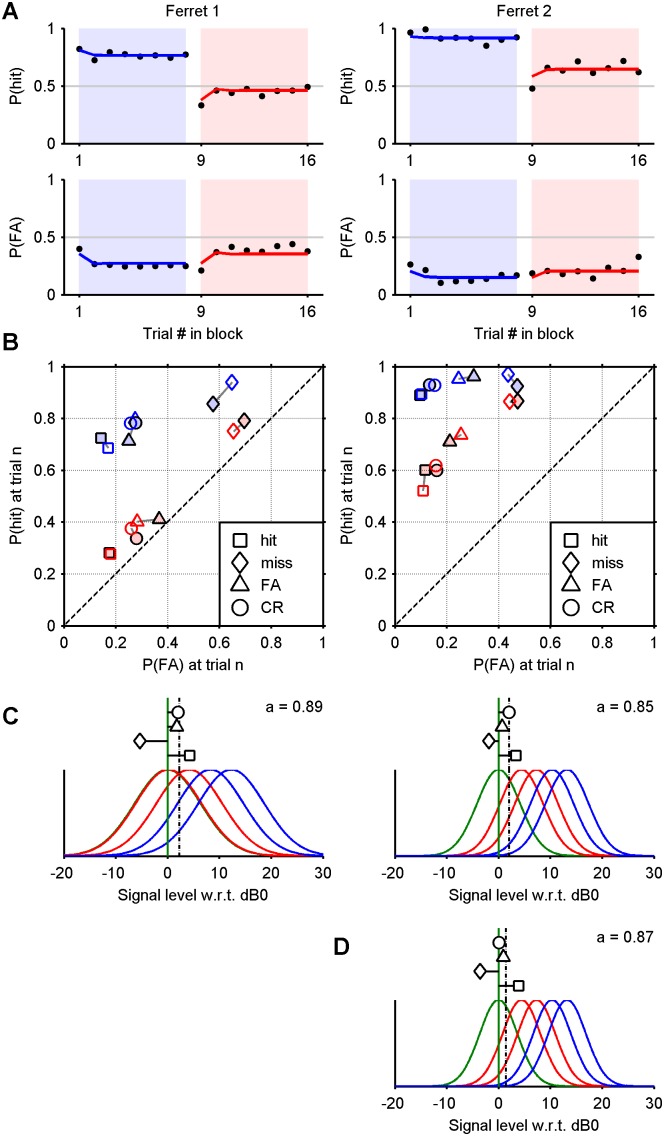
Figure 6. Maximum likelihood fits to data from ferrets 1 and 2.
A) Probability of a hit and false alarm given the position of a trial in a block. Empirical data (dots, see Fig. 3); fit from Markov model based on maximum likelihood parameters (solid lines). B) Probability of a hit and false alarm plotted in ROC space given the outcome of the previous trial. Empirical data (solid markers, see Fig. 4); fit from Markov model based on maximum likelihood parameters (hollow markers). C) Maximum likelihood parameters for alternating blocks of 8 trials (shifts bij, markers on stems–see key in B; c 1, dashed vertical; no/hard/easy signal densities, green/red/blue curves). D) Maximum likelihood parameters for trials presented in a random order (ferret 2 only).

