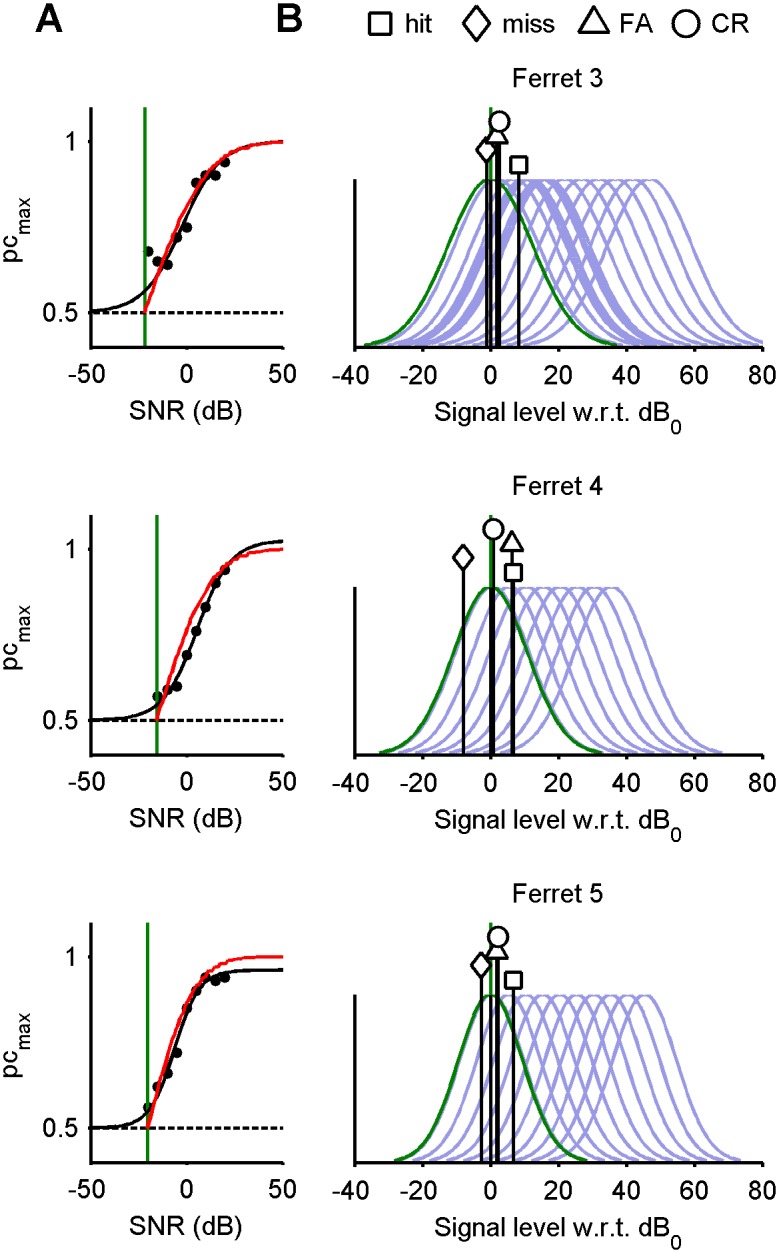
Figure 10. Maximum likelihood parameters fitted to data from ferrets 3, 4 and 5.

A) Sigmoid functions (curve) fitted to psychometric data (markers). The reference level (dB0) is read off at 5% the height of the curve and is shown as a green vertical. The chance line is dashed. Each red curve plots the theoretical psychometric function that results if criterion shifts are removed from the respective fitted models. B) Four fixed threshold positions (bij) corresponding to the four previous outcomes (i.e., full decay, a = 1 followed by a shift relative to c 1 = 0). No-signal and signal densities are plotted in green and light blue, respectively.
