
Figure 11. Hit and false alarm for model with full criterion decay.
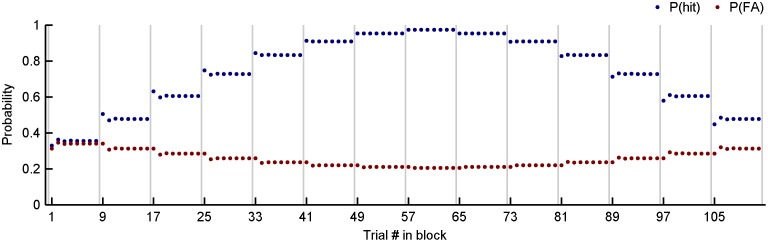
Analytical probability of hit (blue) and false alarm (red) for a model based on the maximum likelihood fit parameters for ferret 4 (a = 0, see fit in Fig. 10B, ferret 4). The model is presented with the stimulus levels shown in Fig. 10B in blocks of 8 trials (50% probability of no-signal), ascending from the hardest to easiest level, and back down again. Note that P(FA) falls and rises again smoothly, and that a small oscillation accompanies the start of each block, which is most noticeable when the signal level is low (e.g., trials 1–3, 9–11).