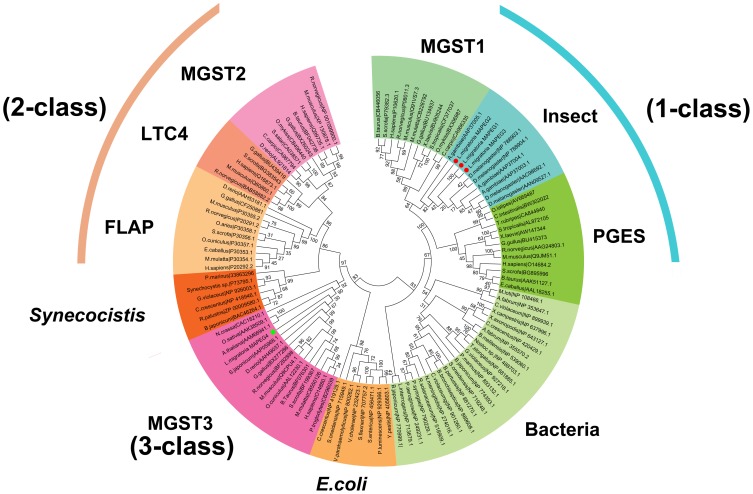
Figure 2. Phylogenetic analysis of microsomal GSTs from L. migratoria and representative insect species.
The bootstrap neighbor-joining tree was generated using MEGA from ClustalW alignments. Branch numbers represent bootstrap values (1000 replicates). The four L. migratoria GSTs are marked with red circle and green square, respectively. The species names and amino acid sequences used to reconstruct the NJ tree are available as S4 Data.

