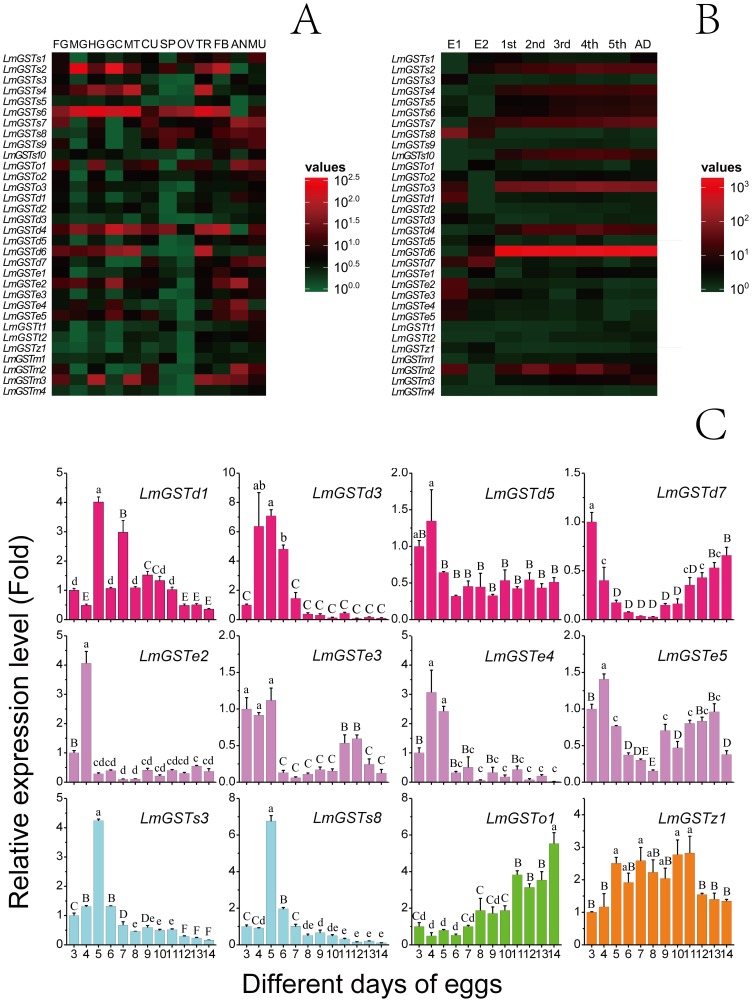
Figure 3. Expression patterns of GST genes from L. migratoria.
(A) Tissue-specific expression patterns of GST genes as evaluated using RT-qPCR: foregut (FG), midgut (MG), hindgut (HG), gastric caecum (GC), Malpighian tubules (MT), cuticle (CU), spermary (SP), ovary (OV), trachea (TR), fat bodies (FB), anterior (AN) and muscles (MU). (B) Developmental stage-specific expression patterns of GST genes as evaluated using RT-qPCR: 5-day and 10-day eggs (E1 and E2), first-(1st), second-(2nd), third-(3rd), fourth-(4th) and fifth-(5th) instar nymphs and adults (AD). The β-actin gene was used as a reference gene. For each gene, relative expression levels are shown with the highest as red and the lowest as green. (C) Relative expression levels of GST genes in egg stage as determined by RT-qPCR. β-actin was used as a reference gene. Data are expressed as means±SE of three biological replications. Small letters and capital letters indicate significant differences at p<0.05 and p<0.01 level, according to ANOVA and LSD test, respectively.

