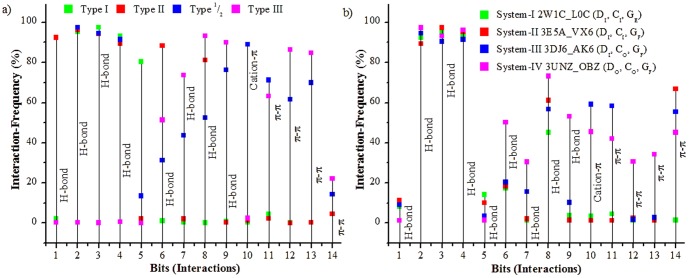
Figure 4. Major interaction sites in AK.
The graphs depict the frequency of the most prominent interactions with different regions of the binding site formed by a) different classes of AK inhibitors from PDB and b) by the inhibitors bound to the four representative conformations during the 40 ns MD simulation. The four classes of inhibitors depicted in fig. 4a are the type I inhibitors which bind to the conserved ATP site in the DFG-in conformation, the type I1/2 which explore an additional back-pocket (BP) formed by the GK in addition to the ATP site in the DFG-in conformation, type III which bind to the allosteric pocket (HPII) in the DFG-out conformation and the type II which explore both the ATP and allosteric pockets in the DFG-out conformation. The details of the simulated systems and inhibitors in fig. 4b have been given in Table 1. The legend 4b describes the system, PDB id of the starting structure, its bound inhibitor and conformation of the major structural motifs. The x-axis represents interactions formed by different pharmacophore and their complementary sites in the binding pockets as given in Table 3.

