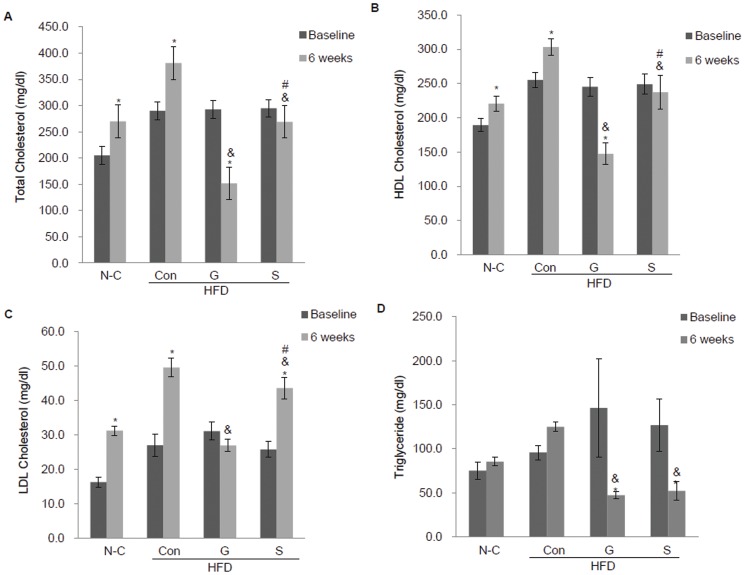
Figure 4. Effects of gefitinib and statin treatments on the serum lipid profile.
Changes in serum lipids after 6 weeks of gefitinib or statin treatment. (A) Total cholesterol, (B) HDL cholesterol, (C) LDL cholesterol, (D) triglyceride levels (n = 10 each, P<0.05). Values represent the means ±SEM. *P<0.05 relative to baseline. & P<0.05 relative to Con, # P<0.05 relative to G. N-C, normal control; HFD, high-fat diet; Con, control; G, gefitinib; S, statin.

