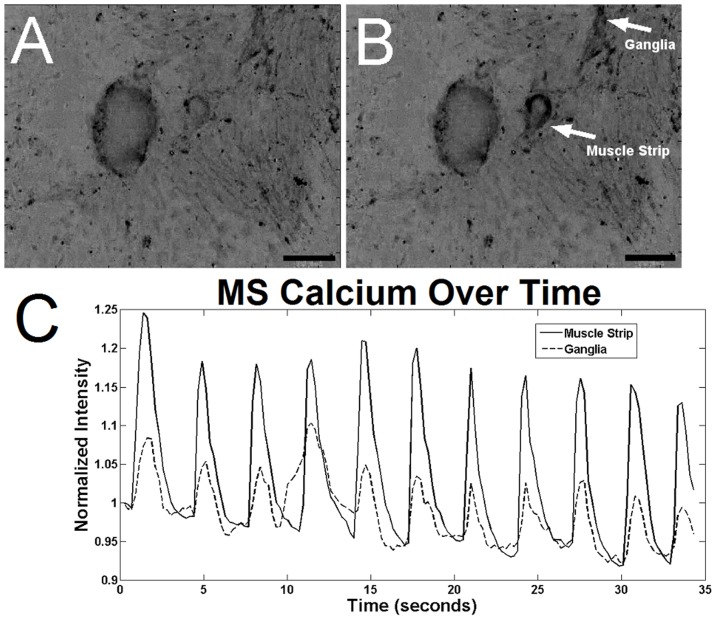
Figure 8. Calcium indicator intensity in cultured MS after 14 days.
An increase in calcium indicator intensity is observed between images of the MS just prior to depolarization (A) and 0.7 seconds later (B), after depolarization (S2 Video). Muscle strips and the surrounding cells that formed a “ganglia” are labeled. Regions of black indicate depolarization. 100x magnification, 200-µm scale bar. A plot of calcium indicator intensity (C) within MS and the “ganglia” show the periodic depolarization waves in the MS culture.

