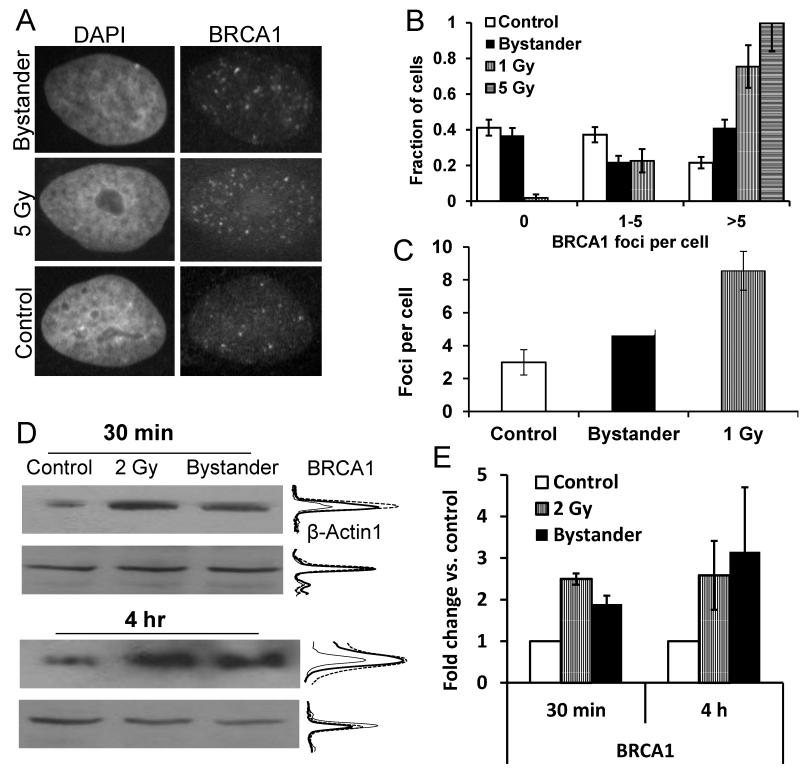
Figure 2.
BRCA1 induction in directly irradiated and bystander T98G cells. (A) Anti-BRCA1 immunofluorescence microscopic images of control, bystander and directly irradiated cells. Nuclei were counterstained with DAPI. (B) Distribution and (C) average values of BRCA1 foci in control, bystander and directly irradiated cells. Foci data were collected from a total of 204 control and 204 bystander cells in four independent experiments and 53 1 Gy and 39 5 Gy-irradiated cells in one experiment. (D) Western blot analysis for BRCA1 and β-actin expression. Densitometric intensity profiles are shown for control (thin line), 2 Gy-irradiated (dashed line) and bystander samples (thick line). Densitometry readings are quantified on a linear scale. (E) Fold change relative to unirradiated controls in BRCA1 expression levels of irradiated and bystander samples following normalisation to β-actin levels. Error bars show the standard errors.

