Figure 3.
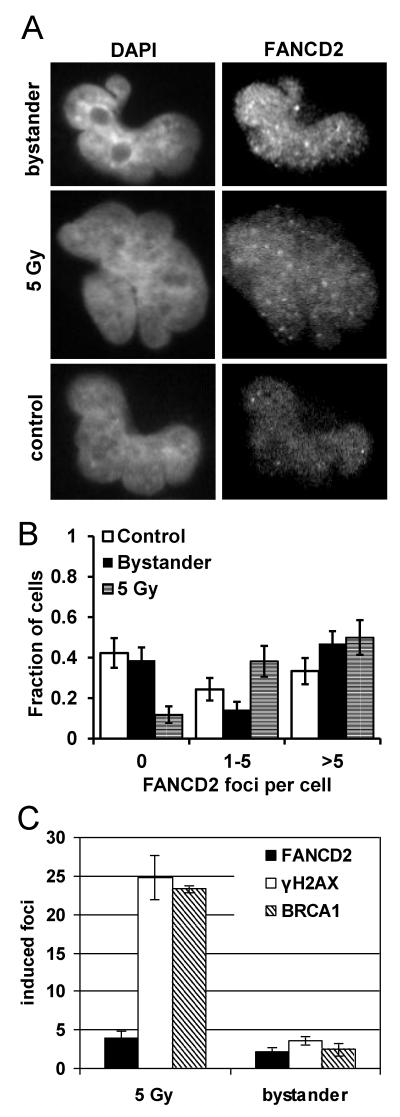
(A&B) Induction of FANCD2 foci in directly 5 Gy-irradiated and bystander T98G cells. The diagram shows the distribution of foci. Foci data were collected from a total of 78 control and 98 bystander cells in two independent experiments and 68 5 Gy-irradiated cells in one experiment. Error bars show the standard errors (C) Bystander and 5 Gy-induced γH2AX, FANCD2 and BRCA1 foci in T98G cells. Foci counts in control samples were subtracted. Bars represent average induced foci per cell; error bars show SEM from 2-5 experiments.

