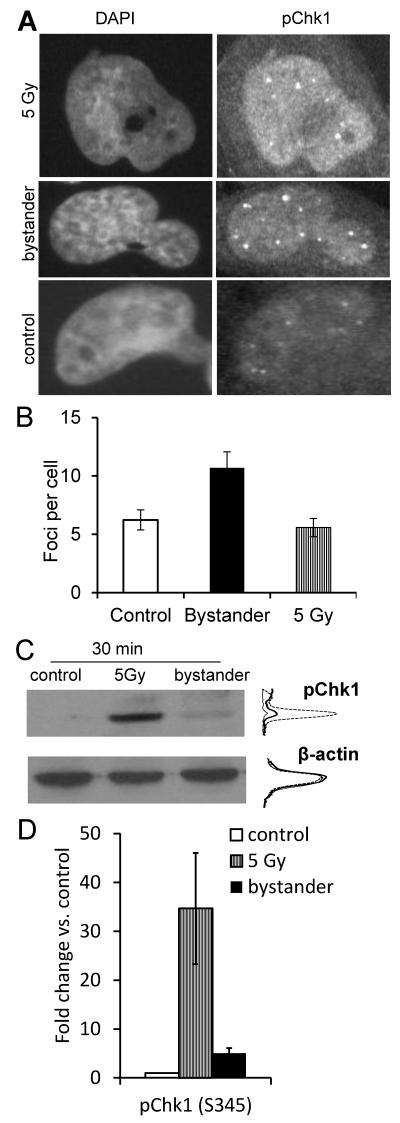
Figure 5.
Phospho-Chk1 foci induction in bystander T98G cells. (B) Bars represent average p-Chk1 foci per cell; error bars show SEM from 2 experiments. (C) Western blot analysis of Chk1 phosphorylation and β-actin expression. Densitometric intensity profiles are shown for control (thin line), 5 Gy-irradiated (dashed line) and bystander samples (thick line). Densitometry readings are quantified on a linear scale. (D) Fold change relative to unirradiated controls in pChk1 expression levels of irradiated and bystander samples following normalisation to β-actin levels. Error bars show the standard errors.

