
Figure 1. Basic retinal wiring diagram colouring book and palette.
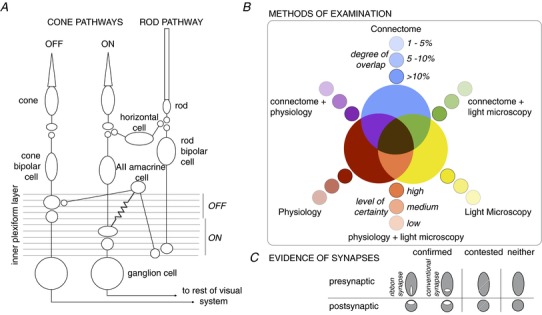
A, basic wiring diagram of the mouse retina. Signals from cones traverse the retina either through ON or OFF cone bipolar cells and ganglion cells. Synaptic connections between OFF bipolar and ganglion cells are predominantly found in the upper 0–40% of the inner plexiform layer, whereas synaptic connections between ON bipolar and ganglion cells are predominantly found in the lower 41–100% of the inner plexiform layer. Horizontal cells provide feedback to photoreceptors. Signals from rods traverse the retina through the rod bipolar pathway, which involves the rod bipolar, AII amacrine cell, electrical synapses with ON cone bipolar cells (symbolized by a resistor), chemical synapses with OFF cone bipolar cells (symbolized by 2 circles in close proximity), and respective connections with ON and OFF ganglion cells. B, colour code of methods used to examine connections. The primary methods include: the connectome, which is the serial reconstruction of electron micrographs (blue); physiological evidence (red); and light microscopy used to determine appositions (yellow). Combinations of methods are indicated by secondary colours: connectome + physiology (purple), physiology + light microscopy (orange), and connectome + light microscopy (green). Finally, in the case of all three methods of examination, connectome + physiology + light microscopy, the terminal is coloured brown. The saturation of colours indicates either the degree of overlap between cells, as determined in the connectome, or the level of certainty for the other methods of examination. C, evidence for the presence of synaptic marker proteins, either by ultrastructure or light microscopy, is indicated by white ovals within the pre- and/or postsynaptic terminals. Shape of the presynaptic oval represents either a ribbon synapse (vertical) or conventional synapse (horizontal). Contested synapses are indicated by a diagonal line through the terminal. If synaptic markers have not been examined, the terminal is left a solid colour to indicate that only pre- and postynaptic cell fills were used. These colours and symbols are consistently used throughout the figures.