
Table 2.
Matrix of bipolar-to-ganglion cell connectivity and relationship to the primary rod bipolar cell pathway
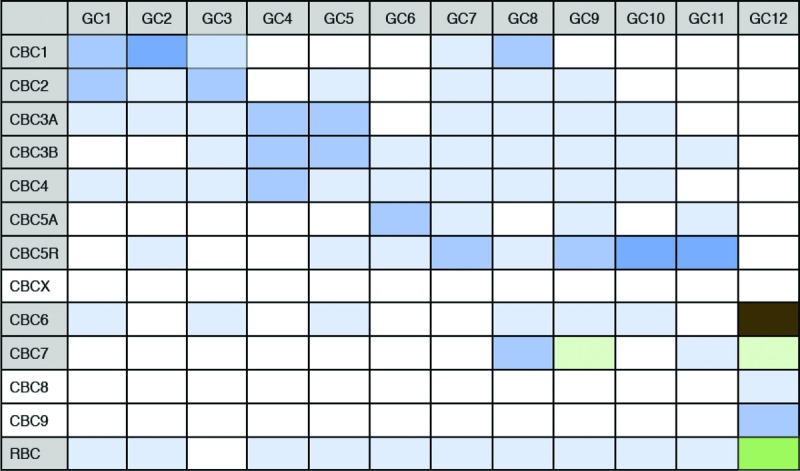 |
Table of connections between ganglion cell types (GC) and cone bipolar cell types (CBC) and the rod bipolar cell (RBC). Matrix form of same data shown in Fig.2 to illustrate that each ganglion cell described in the connectome would receive input from the rod bipolar cell pathway. Hue and saturation of the boxes correspond to the same key explained in Fig.1. Multiple connections in each column indicate convergence between multiple bipolar cell types to each ganglion cell type. Multiple connections in each row indicate divergence from one bipolar cell type to multiple bipolar cell types. If the bipolar cell type has ≥1% connectivity with the AII amacrine cell, then the bipolar cell label is coloured grey (first column). Connectivity between the bipolar cell and AII amacrine cell is normalized by the AII amacrine cell's total connectivity.