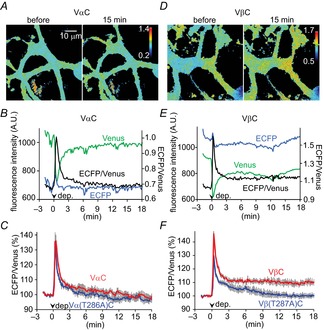
Figure 9. βCaMKII is more strongly activated than αCaMKII in a PN.

A and B, representative images (A) and time courses of fluorescence signal of ECFP, Venus and ECFP/Venus (B) of VαC before and after the conditioning depolarization. C, averaged time courses of ECFP/Venus before and after the conditioning depolarization in a PN expressing VαC or Vα(T286A)C. n = 7 for each. D and E, representative images (D) and time courses of fluorescence signal of ECFP, Venus and ECFP/Venus (E) of VβC before and after the conditioning depolarization. F, averaged time courses of ECFP/Venus before and after the conditioning depolarization in a PN expressing VβC or Vβ(T287A)C. n = 6 for each.
