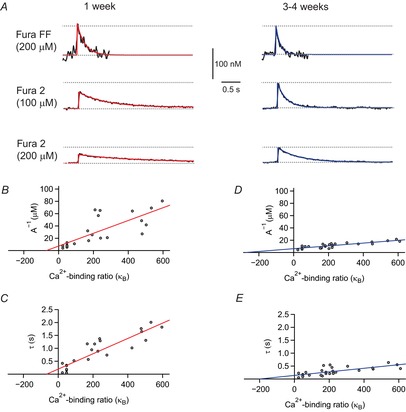
Figure 3. Small Ca2+ buffer capacity and slow extrusion rate in young pyramidal cells.

A, action potential (AP)-evoked Ca2+ transients in cells from rats aged 1 week (left) and 4 weeks (right) measured with Fura-FF and different concentrations of Fura 2 (single AP, black traces). Red and blue lines represent monoexponential functions fitted to the measured data. B, inverse peak amplitudes plotted vs. exogenous calcium buffer capacity κB at 1 week (n = 23). C, open circles represent measured monoexponential decay time constants plotted vs. exogenous calcium buffer capacity κB. The red lines in B and C show a linear regression through the data points. D, inverse amplitudes plotted vs. exogenous calcium buffer capacity κB in cells from rats aged 3−4 weeks (n = 28). E, open circles represent measured monoexponential decay time constants for transients plotted vs. exogenous calcium buffer capacity κB. The blue lines in D and E show a linear regression through the data points.
