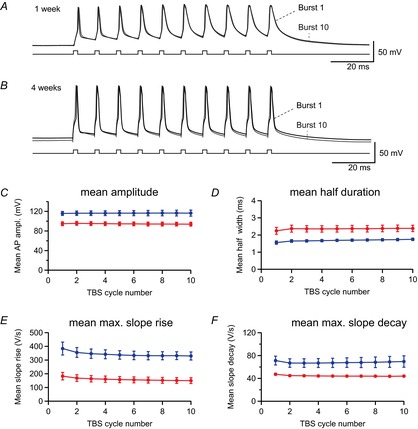
Figure 7. Small changes of action potential (AP) waveform during repetitive theta-burst firing.

A, the first (black) and 10th (grey) bursts recorded during a 5 Hz theta-burst stimulation (TBS) are superimposed for a young pyramidal cell (P9). B, similarly, the first (black) and 10th (grey) bursts are superimposed for a mature cell (P28). C−F, the mean amplitude (C), mean half-duration (D), mean maximal slope of rise (E) and mean maximal slope of decay (F) were calculated from all 10 APs for each burst and plotted against burst number in animals aged 1 week (red, n = 4) and 4 weeks (blue, n = 6).
