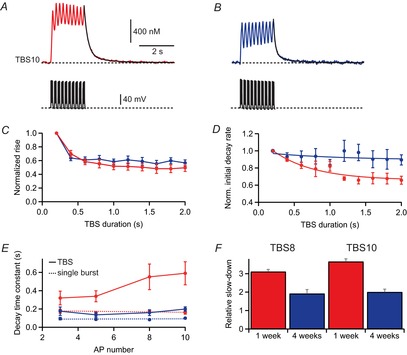
Figure 9. Activity-dependent slow-down of extrusion during theta-burst firing.

A, B, Ca2+ transients evoked by backpropagating action potentials (bAPs) during theta-burst stimulation (TBS) 10 in a young (P7) and a mature (P28) pyramidal cell (top). Corresponding APs measured in current clamp (bottom). C, rising slope of the Ca2+ concentration during each burst in TBS was normalized to the first burst and plotted against the theta cycle in young (n = 4, red) and mature (n = 6, blue) pyramidal cells. D, the initial decay rate after each burst was divided by the peak amplitude, normalized to decay of the first burst and plotted against the theta cycle. The solid lines represent an exponential fit through the measured data points to estimate TTBS [eqn (15)]. E, amplitude-weighted decay time constants after the end of theta-burst firing. Dotted lines represent the linear regression lines obtained from the decay of brief bursts (Fig.4E). F, the ratio of amplitude-weighted TBS decay time constant divided by the average brief burst decay time constant (from Fig.4) for TBS8 and TBS10 (eight or 10 APs at 100 Hz repeated 10 times at 5 Hz).
