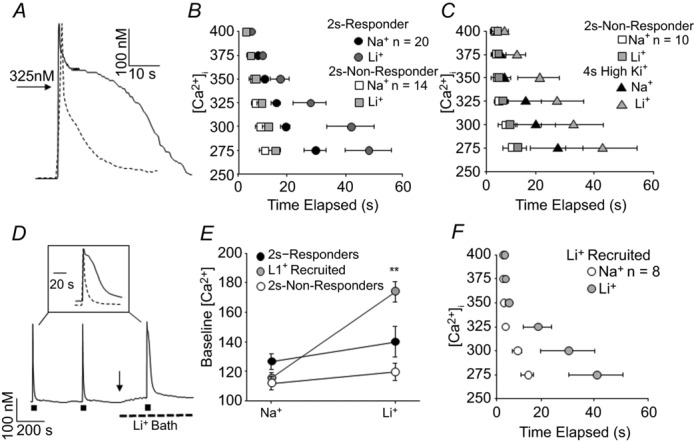
Figure 3. Ca2+ transient parameters associated with evoked NCX activity.

A, high K+ (30 mm, 4 s) evoked Ca2+ transients from an IB4+ (continuous trace) and an IB4– (dashed trace) cutaneous DRG neuron, in which a concentration of 325 nm Ca2+ is indicated to provide a benchmark to evaluate the amplitude–duration relationship. B, pooled transient amplitude–duration (time elapsed at or above a level [Ca2+]i) data for the 2 s-responders and 2 s-non-responders analysed in Fig.2E and F, where transient duration data before and after Li+ application are plotted. The evoked transient for each neuron was analysed as a function of the duration at which the transient was at or above concentrations ranging from 275 to 400 nm using increments of 25 nm Ca2+. C, data for the 2 s-non-responders in B (in response to the 2 s high K+ application) are replotted along with the average amplitude–duration data for these neurons in response to the 4 s high K+ application (4 s High K+), before (Na+) and after (Li+) NCX block. D, evoked NCX activity was detected in a third subset of neurons in which application if Li+ resulted in an increase in resting [Ca2+]i (arrow). Inset: evoked Ca2+ transients before (dashed line) and after (continuous line) NCX block. E, pooled data demonstrating the significant shift increase in resting [Ca2+]i with application of Li+ in a subset of neurons (Li+ Recruited, P < 0.01, n = 8) in which evoked NCX activity was subsequently detected. F, pooled amplitude–duration data for the subset of neurons in which the Li+-induced increase in resting [Ca2+]i resulted in the recruitment of evoked NCX activity.
