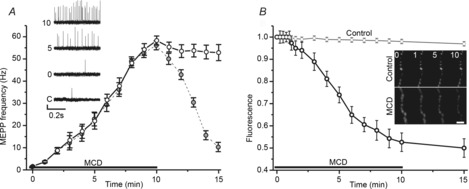
Figure 1. Kinetics of spontaneous release and synaptic vesicle exocytosis during cholesterol depletion.

A, changes in MEPP frequency (Hz) induced by 10 mm MCD (open circles) and when MCD–cholesterol complex (5 mm) was applied immediately after MCD application (grey circles). Insets show traces illustrating MEPPs at different times before (C, control) and after the start of MCD application (0, 5 and 10 min in the presence of MCD). Vertical scale bar is 0.2 mV. B, time course of changes in nerve terminal fluorescence in response to MCD application. Nerve terminals were preloaded with FM1–43. Insets, fluorescence images of segments of the nerve terminals at rest and different times (in min) during MCD application. Scale bar is 3 μm. Fluorescence is normalized to the pre-MCD baseline fluorescence. Horizontal lines indicate the application of MCD. Data are mean ± SEM.
