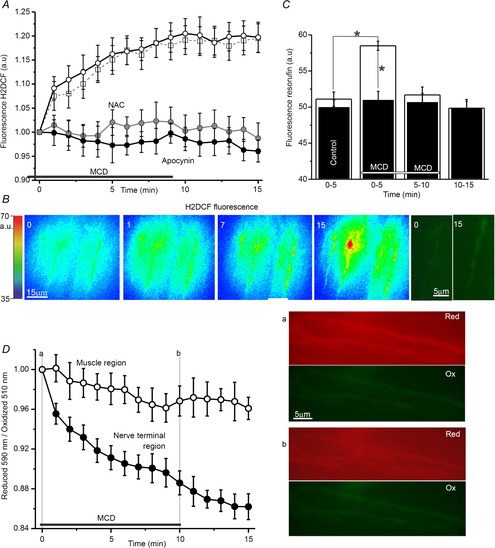
Figure 2. ROS production and cholesterol depletion at frog neuromuscular synapses.

A, changes in H2DCF fluorescence in synaptic areas induced by MCD (open circles) and the effects on those changes of ROS antagonists (NAC/antioxidant, grey circles; apocynin/NADPH oxidase inhibitor, filled circles) or TRPV1 antagonist (capsazepine, open squares). B, pseudo-colour images of H2DCF fluorescence captured at time points 0, 1, 7, 15 min from the onset of MCD application. The corresponding intensity scale is provided to the left (a.u.). Right, magnified native fluorescence images of synaptic regions (0 before and 15 min after cholesterol depletion). C, fluorescence of resorufin (indicator of extracellular H2O2 level generated within 5 min). Open columns display the fluorescence before (from 0 to 5 min), during MCD treatment (from 0 to 5, from 5 to 10) and after washing (from 10 to 15 min) in control, whereas filled columns illustrate similar conditions but with NADPH oxidase blocked by apocynin. Asterisks denote significant differences (*P < 0.05). D, detection of membrane lipid peroxidation using fluorescence iT-sensor in synaptic (filled circles) and extrasynaptic muscular (open circles) regions. Values are the normalized ratio of the intensities of red to green fluorescence of the Image-iT lipid peroxidation sensor with time. To the right are images of red (reduced form, Red) and green (oxidized form, Ox) iT-sensor fluorescence in the synaptic region. The images illustrate the shift of fluorescence before (top, a) and after (bottom, b) MCD treatment. The horizontal line in A, C and D indicates the period of MCD application. Data are mean ± SEM.
