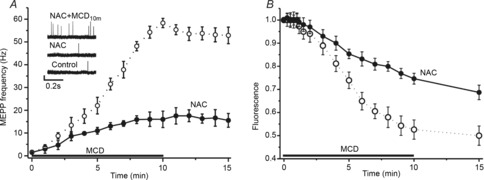
Figure 3. ROS involvement in the MCD effects on spontaneous release and synaptic vesicle exocytosis.

A, MCD-induced changes in MEPP frequency in control conditions (open circles, from Fig. 1) and when ROS were chelated by the antioxidant, NAC (filled circles). Insets show traces of MEPPs in control, 40 min after perfusion with NAC and 10 min after MCD application in the presence of NAC. B, time course of FM1–43 dye unloading from pre-loaded nerve terminals in response to MCD application (from Fig. 1) and in the presence of antioxidant. Other details are as in Fig 1. Data are mean ± SEM.
