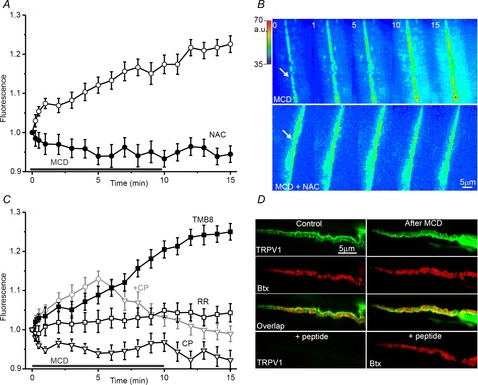
Figure 4. MCD effects on the intracellular Ca2+ level in the nerve terminal region: dependence of MCD action on ROS production and Ca2+ channels.

A and C, changes in Fluo4 fluorescence at neuromuscular synapses under the influence of MCD alone (open circles, A); and in conditions of ROS chelation by NAC (filled circles, A); or inhibition of different types of Ca2+ channels (C). TMB-8 was used to block inositol trisphosphate and ryanodine receptors in the endoplasmatic reticulum (filled squares). Ruthenium red was applied to inhibit both ryanodine receptors and TRPV channels (open squares, RR). TRPV channels were blocked with capsazepine (open triangles, CP). The grey line (+CP) indicates the experiments in which capsazepine was applied 5 min after the onset of MCD. Values are normalized fluorescence (the initial fluorescence before MCD addition was taken as 1.0). Data are mean ± SEM. B, pseudo-colour images of Fluo4 fluorescence in synaptic regions at time points 0, 1, 5, 10 and 15 min from onset of MCD application in control solution (top) and in the presence of the ROS chelator NAC (bottom). Nerve terminal regions are marked by arrows. The corresponding intensity scale is shown on the left of the image (a.u.). D, immunolocalization of TRPV1 channels at control (left) and MCD-pretreated (right) neuromuscular junctions. Fluorescent images of preparations double-labelled with anti-TRPV1 antibody (green channel, top) and rhodamine-conjugated α-Btx (Btx, red channel, second row). The images in the green and red channels were merged (overlap) to illustrate the relative disposition of TRPV1 channels and postsynaptic acetylcholine receptors (third row). The lowest row shows images of a control preparation immunolabelled with TRPV1-specific antibody (left) and Btx (right) in the presence of a specific blocking peptide (see text for further details).
