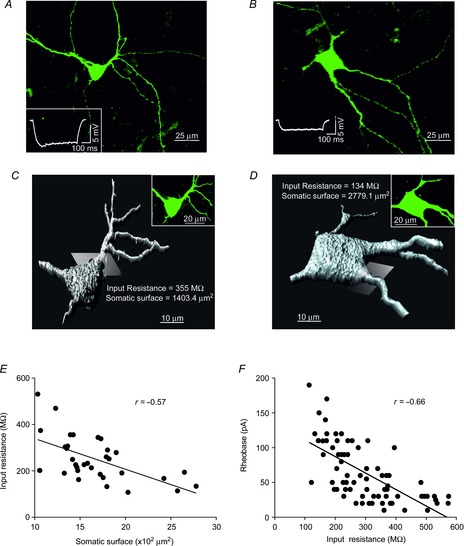
Figure 1. Relationship between cell size, input resistance and rheobase in MNs of the rat oculomotor nucleus.

A and B, cell bodies and main dendritic trees of two MNs with input resistances of 355 MΩ (A) and 134 MΩ (B). Insets in (A) and (B) show the membrane potential responses to negative current steps (20 pA) of labelled MNs. C and D, three-dimensional reconstruction of the MNs shown in (A) and (B), respectively. To obtain the somatic surface values the Imaris software established a separation by a plane between the cell body and main dendrites (one of these planes is shown for each MN). E, relationship between somatic membrane surface area and input resistance (n = 33). F, relationship between input resistance and rheobase (n = 73). Linear correlations are illustrated. MNs, motoneurons.
