
Figure 2. Analysis of glioma cell movement during bradykinin application.
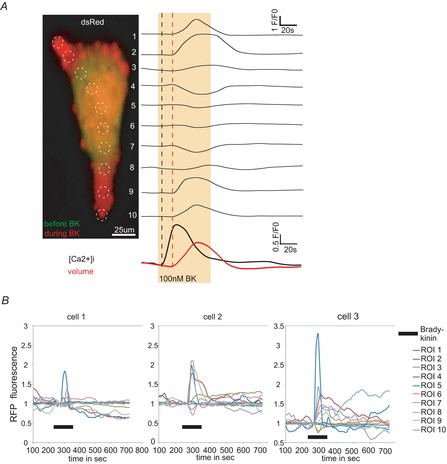
A, dsRed fluorescence of z-projections (see also Supporting information Video S1) for every time point was analysed within ROI 1–10 (indicated by dashed white circles). Picture shows cell before (green) and during a 2 min 100 nm bradykinin application (red). On the right side individual traces of every ROI are shown. Bradykinin application is indicated by a yellow box. For comparison traces of [Ca2+]i and cell volume are shown at the bottom. Notice that D54 cells show shape changes only in certain compartments of the cell. Membrane blebs occurred mainly in the periphery. B, dsRed fluorescence of 3 example glioma cells analysed like the cell in A. Traces have been normalized to mean baseline intensity (F0) Black bar indicates application of 100 nm bradykinin for 2 min.