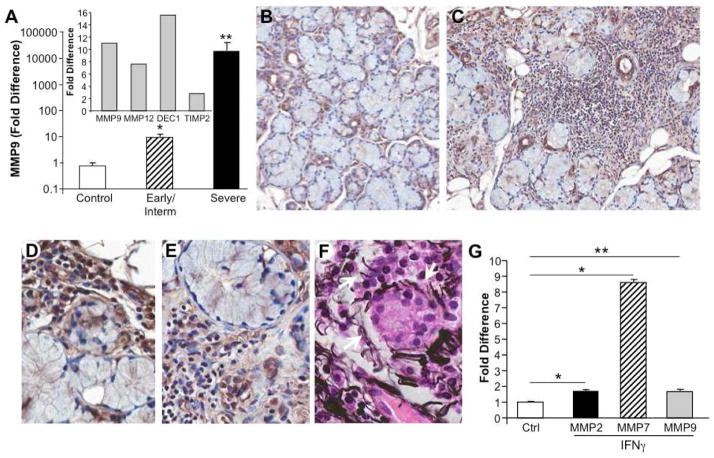
Figure 7. MMP expression in MSG.
A) By microarray, SS salivary glands with severe lesions exhibited enhanced MMP9, MMP12 and ADAMDEC1 expression relative to gland tissues from subjects without SS and minimally increased TIMP2 (inset). By RT-PCR, MSG tissues from additional populations (n=5–6/group) were analyzed for expression of MMP9. By comparison to non-SS MSG, those tissues with early/intermediate disease exhibited a significant elevation in MMP9 expression (*p=0.004), with a more dramatic elevation in the severely inflamed and damaged MSG (**p=0.006). B) Immunohistochemical staining for MMP9 in control MSG revealed staining in ductal cells and/or in the periductal regions. Original magnification 20X. C,D,E) Compared to control MSG, tissues obtained from patients with severe SS exhibited extensive staining for MMP in the infiltrate and around acini (C, original magnification 20X), consonant with basal lamina damage, detachment of acinar cells, loss of nuclear polarity and disrupted structural integrity (D, E). Original magnification 40X. F) Immunohistochemistry using Jone’s PAMS stain for basement membrane identifies areas of fragmented basement membrane, particularly evident around acinar structures (white arrows). Original magnification 40X. G) Monocytes were cultured in the presence or absence of IFNγ (10ng/ml) for 4hr and MMP2, MMP7 and MMP9 expression monitored by RT-PCR. * p<0.01, **p=0.05 compared to control unstimulated macrophages (no IFNγ).

