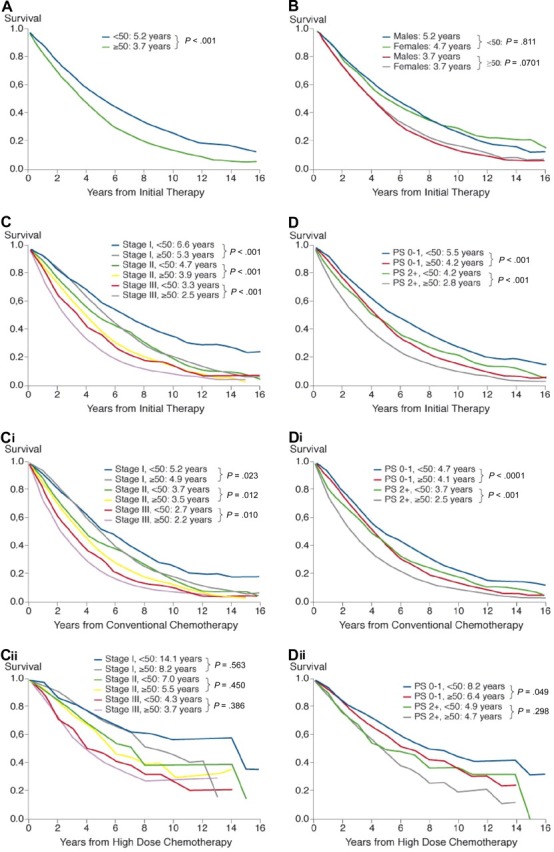
Figure 1.

Cumulative relative survival in the entire sample of 10 549 patients stratified by age (A), age and sex (B), age and ISS stage (C), and age and performance status (D) in all patients, in patients treated with conventional therapy stratified by age and stage (Ci) and age and performance status (Di), and in patients treated by high-dose therapy stratified by age and stage (Cii) and age and performance status (Dii). Inserts show median values adjusted for relative survival and P values.
