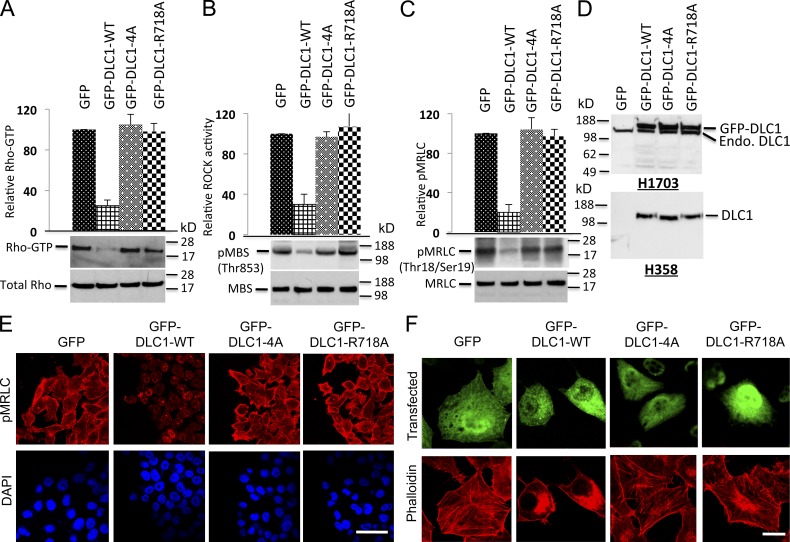
Figure 4.
DLC1-4A mutant behaves similarly to the “GAP-dead” mutant. (A) The GFP-DLC1-WT–positive control reduced RhoGTP, but the GFP-DLC1-4A mutant was as defective as a “GAP-dead” GFP-DLC1-R718A mutant for negative regulation of RhoGTP. (top) Densitometry quantification ± SD (error bars) of three experiments (P < 0.001) for GFP-DLC1-WT compared with indicated stable transfectants in H1703 cells. The graph represents the RhoGTP/total Rho ratio (n = 3). (B) Experimental conditions and data displays are similar to A but for ROCK activity. (C) Experimental conditions and data displays similar to A but for pMRLC. (D) Expression of stable DLC1 transfectants in H1703 (top) and in H358 cells (bottom). (E) GFP-DLC1-WT transfectants have less pMRLC immunofluorescence and fewer concave boundaries, which is consistent with reduced contraction, unlike the other transfectants. DAPI (blue) represent nuclei. The confocal images are representative of the majority of cells. Bar, 100 µm. (F) DLC1-WT has fewer stress fibers (as measured by red phalloidin), especially in the center region of the cells compared with the other transfectants. GFP (green) fluorescence identifies transfected cells. The confocal images are representative of the majority of cells. Bar, 20 µm.

