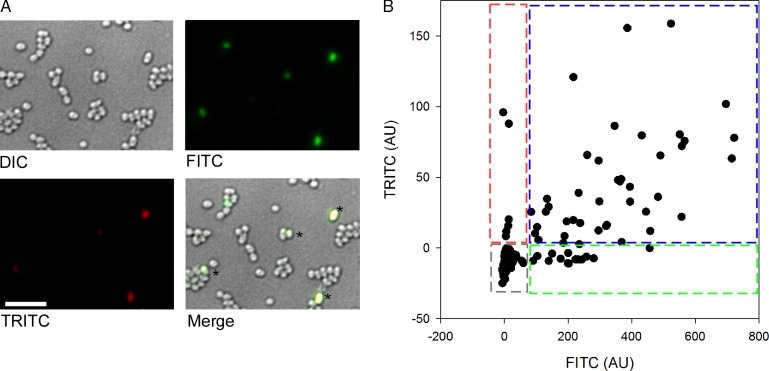
Figure 7.
Coordinated expression of chiA and chiX. Representative data for chiA and chiX expression as followed via GFP and mKate fluorescence, respectively, for strain FTG006 (ΔchiX::mkate and ϕchiA::gfp). (A) Representative still frames of the FTG006 strain. Cells were grown for 16 h in rich media, and images were taken using a 100×, 1.4 NA lens (Olympus) and a camera (CoolSNAP HQ). Asterisks highlight cells that exhibit both red and green fluorescence and so appear yellow upon merging. Bar, 10 µm. (B) The background level for both channels was calculated as the mean value of S. marcescens Db10 parent strain grown under the same conditions, plus two times the standard deviation. This value was subtracted from the fluorescence values obtained for strain FTG006. TRICT values in arbitrary units (AU) are plotted on the y axis, and FITC (arbitrary units) is plotted in the x axis. 500 cells are represented, and the boxed areas on the chart highlight cells with TRICT only (red), FITC only (green), and TRICT with FITC (blue) expression. The cell population analyzed was biased toward analysis of the fluorescent cells to allow the ability of coexpression to be viewed.

