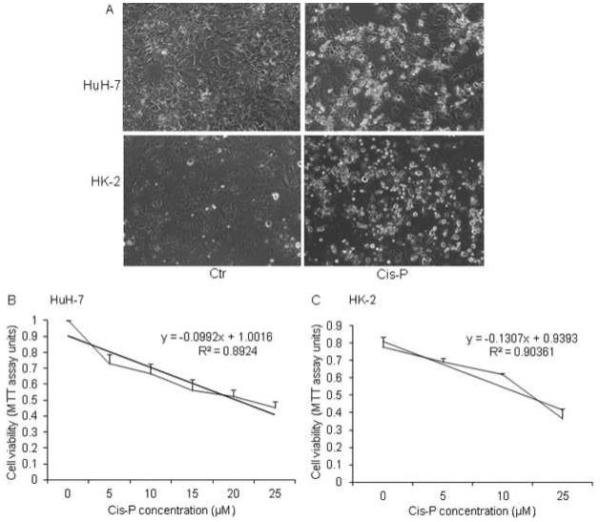
Figure 1. Cis-P cytotoxicity in HuH-7 and HK-2 cells.

A. Phase contrast microscopy for morphological changes in Cis-P-treated HuH-7 and HK-2 cells. Shown are cells with or without IC50 doses of Cis-P. These were calculated with dose response analysis of Cis-P cytotoxicity by MTT cell viability assays and were 15 μM and 25 μM for HuH-7 and HK-2 cells, respectively (B).
